Characterization of Polymers using Dynamic Mechanical Analysis (DMA)
Home » Characterization of Polymers using Dynamic Mechanical Analysis (DMA)
Polymers respond to the energy of motion in two ways: (1) elastic response which is important for shape recovery and (2) viscous response which is essential for dispersing mechanical energy and preventing breakage. Dynamic mechanical analysis (DMA) is used to study these responses, called viscoelastic properties, under conditions of low applied mechanical force.
Polymer viscoelasticity is dependent on temperature and time. Controlled heating and cooling are incorporated in DMA instruments to study temperature effects on polymer stiffness and resiliency.
The test speed or time scale used for mechanically deforming the polymer enables study of time (or frequency) effects on resistance to permanent deformation. Knowledge obtained through strategic use of the three parameters of force, temperature and time provides the basis for predicting polymer performance in real world applications. Some key DMA study areas that answer the need for timely and effective characterization of polymer mechanical properties include:
- Mapping the “viscoelastic spectrum”, which shows temperature (and time) dependent modulus changes from hard/rigid to soft/rubbery
- Determining the glass transition temperature (Tg) of polymers
- Tracking the changes in elastic (or shear) modulus as a function of frequency
- Characterizing “damping” behavior: dissipation of mechanical energy through internal motion (loss modulus, tan delta)
- Comparing mechanical properties of different polymers (quality, failure analysis, new material qualification)
- Studying phase separation of polymer blends or copolymers
- Determining effects of physical aging, crosslinking or post-cure on mechanical properties and Tg
- Evaluating changes in performance imparted by inorganic fillers and/or processing additives
- Time-Temperature Superpositioning (TTS): predict polymer behavior over a wider frequency or time range using a few strategic DMA tests
- Transient measurements for evaluating creep, stress relaxation and stress-strain properties
This paper provides an overview of basic DMA testing and polymer case studies to demonstrate how this technique serves the need for fundamental evaluation of polymer mechanical properties.
BASICS OF DYNAMIC MECHANICAL ANALYSIS (DMA)
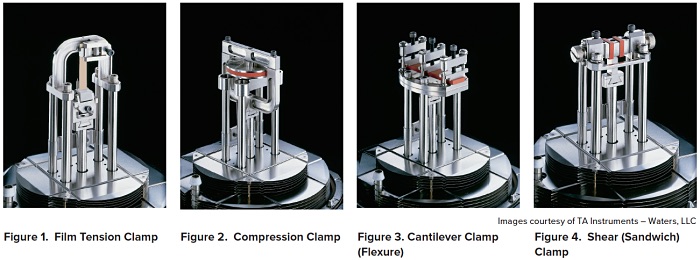
DMA utilizes a system of clamps for mechanical testing of solid polymeric materials. The polymer test sample must first be trimmed, cut or molded into a shape that will work with the selected clamp type. Clamp selections for polymer samples are based on giving the most suitable type of mechanical motion for the specific study type:
- Tension (stretch)
- Compression (push)
- Flexure (bend)
- Shear (motion parallel to the sample surface)
Figures 1 – 4 show examples of the various clamp types.
The most suitable clamp is not only based on the preferred mechanical motion (i.e. stretch, bend, shear, etc.), it must work with the type of polymer to be tested. For example, the film tension clamp works for thin (≤2 millimeter) and flexible to semi-rigid films. However, if the film is thick or very stiff, the substitution of a flexural clamp normally gives a close approximation for tensile properties of isotropic polymer materials.
All DMA clamp configurations feature a movable clamp and one or more stationary clamps, which are used to mount the sample. The movable part applies force and displaces the sample by stretching, bending, shearing or compressing it. Some clamp types must place an initial low force on the sample before setting the clamp in motion. This keeps the sample taut (tension) or maintains contact between the movable clamp and sample (compression, 3-point bend) throughout a dynamic test.
A strain-controlled dynamic test involves programming the clamp to:
- Move or “displace” the sample by a constant specified distance in a sine wave cycle (oscillation)
- The oscillation continues at a specified frequency or series of frequencies
As the force moves the clamp at the specified displacement, the amplitude of the response is measured. The stress and strain responses of the material are calculated for each cycle based on the geometry and dimensions of the sample.
In force-controlled dynamic tests, the clamp movement is programmed to:
- Apply a constant specified force or stress to displace the sample in a sine wave cycle (oscillation)
- The oscillation continues at a specified frequency or series of frequencies
As the cyclic displacement of the material occurs at the specified force, the amplitude of the response is measured. The stress and strain responses of the material are calculated based on the geometry and dimensions of the sample.
The stress and strain values of viscoelastic materials, including polymers, are a function of temperature, time, frequency, and the applied oscillation amplitude. This is an important difference between dynamic testing and static mechanical testing. The application of a sinusoidal displacement in dynamic testing results in a sinusoidal elastic response of the material. It is not the goal to load the polymer until it breaks or falls apart. The goal of DMA is to study the elastic and viscous responses of materials in the linear viscoelastic region (LVR), which means under low force conditions that do not destroy the structure.
DMA is used to determine which conditions change the “original” viscoelastic behavior of the sample, and possibly lead to small irreversible deformation of the original structure. An example is a temperature sweep DMA test, which monitors modulus as a function of increasing temperature. As a thermoplastic polymer is heated, it will eventually undergo a phase transition where original elasticity is lost and the polymer becomes fluid and deforms irreversibly.
This is known as the glass transition temperature (Tg), and in DMA, this state is where the viscous response predominates. The low force ensures that Tg is a measurable part of the viscoelastic spectrum because the deformations within the material are on the order of micrometers. Therefore, the material is not pulled apart or squeezed out by the clamps during the measurement.
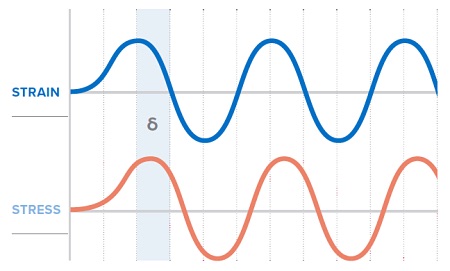
Figure 5 shows a simple illustration of a hypothetical sinusoidal strain input to the sample (blue curve) and the sinusoidal stress response measured by the DMA instrument (red curve). The dotted lines show that the stress response of the material is out of phase with the strain input, which is the behavior exhibited by viscoelastic materials. The degree to which it is out of phase is known as the “phase angle”, denoted by the Greek letter delta (δ).
The relationship of stress and strain depends on the phase angle, which is a function of how much the polymer response lags behind the strain input. This relationship is used to derive trigonometric equations that produce three quantifiable properties that describe the sample response under the applied testing conditions.
These are:
- E’= STORAGE MODULUS
- E”= LOSS MODULUS
- E”/ E’= TAN δ
When the sample is tested in shear mode, the storage and loss modulus are denoted as G’ and G”, respectively. And tan δ becomes G”/G’.
Storage modulus corresponds to the mechanical energy stored by the material during a loading cycle. Consequently, the storage modulus is related to the stiffness and shape recovery of the polymer during loading. The loss modulus represents the damping behavior, which indicates the polymer’s ability to disperse mechanical energy through internal molecular motions.
Tan delta is a sensitive indicator of the thermal/mechanical conditions that cause significant bond rotation or intermolecular friction and flow.
DMA CASE STUDIES OF POLYMERIC MATERIALS
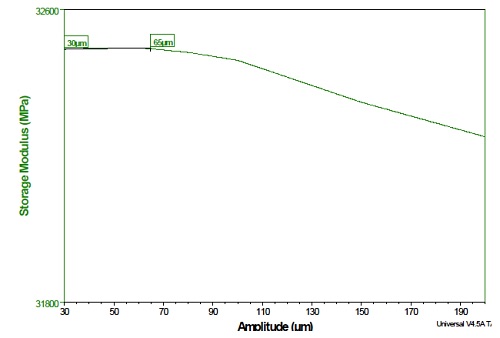
As discussed above, dynamic testing utilizes low forces to ensure that the polymer structure is not destroyed while measuring viscoelastic properties. Consequently, the first step in analyzing a polymer sample is to determine the force or amplitude range that works within the linear viscoelastic region (LvR) of the material. To find the LvR, a test called an amplitude sweep is performed in which the sample is oscillated through a range of strain or stress amplitudes (at constant temperature). The goal is to find the amplitude range that corresponds to the desired “linear response” which means that the modulus measurement is the same regardless of the strain (or stress) amplitude.
Figure 6 shows data acquired for a polymer specimen during an amplitude sweep at 1 Hz (frequency) and 25°C. The LvR in this case is between 30 and 65 μm (slope ≈ 0). An amplitude value within this range must be chosen when setting up tests to measure the modulus and tan delta of these specimens.
VISCOELASTIC PROPERTIES AS A FUNCTION OF TEMPERATURE
DMA is a sensitive technique for studying how the viscoelastic properties of polymers change as a function of thermal environment. If the same frequency is used for the oscillation cycle, a meaningful comparison can be made between different materials under identical thermal conditions.
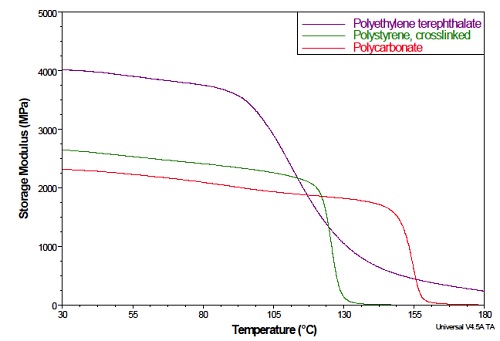
For example, Figure 7 compares the storage modulus (E’) curves for three different polymers that were obtained using a heating ramp rate of 3°C /minute and an oscillation frequency of 1 Hz. The relatively flat regions at the lower temperatures correspond to the glassy (rigid) state of each polymer. The polymer glass transition (Tg) starts where the curves initially bend downward. Beyond this point, the polystyrene and polycarbonate curves show a steep drop off (rapid decrease in modulus), which results from significant softening and rubbery flow. The polyethylene terephthalate (PET), which contains crystalline structure, shows a much more gradual modulus decrease after the onset of Tg.
The crystallites in PET act as physical crosslinks, which toughen the material and give a higher storage modulus below and above Tg. This example shows that DMA is a relatively simple technique for comparing the modulus and Tg of polymers, which can assist with design, processing and applications.
DMA storage modulus plots can be used to calculate the Tg onset temperature of a given polymer. This is done using the graphical intersection of two lines drawn tangent to the E’ curve. First, a tangent is drawn along a selected part of the curve before the transition. Then a second tangent is drawn from the inflection point of the curve to the approximate midpoint of the modulus drop.
Two examples are shown in Figure 8 (black curve for polyvinyl chloride and green curve for polycarbonate). However, it is normally preferred to calculate Tg using the peak maximum in the tan delta plot (Figure 8 – red curve for polyvinyl chloride and blue curve for polycarbonate). The reason is that accurate placement of the tangents is subject to more uncertainty compared to accurately defining the apex of a peak.
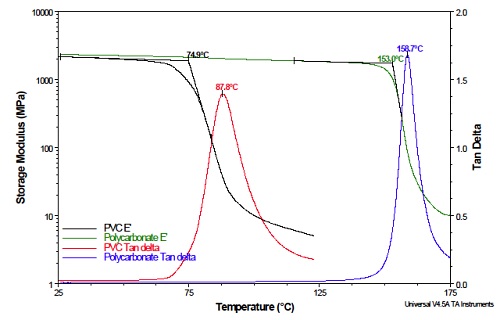
The Tg temperatures calculated by E’ tangent and tan delta methods for a specific polymer are not identical. This emphasizes the fact that polymer glass transitions occur over a temperature range (not at a single temperature). When setting design and processing parameters for specific polymers, it is important to know the temperature where segmental molecular motion begins.
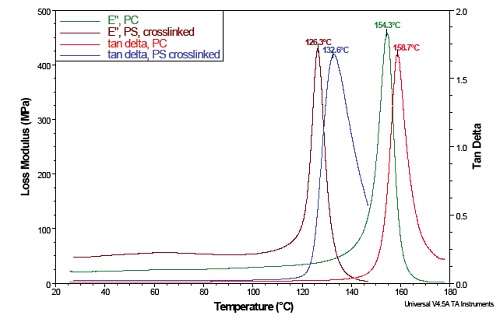
The DMA loss modulus, E”, is very useful in this respect because it is a measure of the viscous nature of polymeric materials. The peak maximum of E” corresponds to the beginning of significant segmental motion of the polymer chains. Thus, the mechanical energy input is dispersed as heat by the internal friction caused by chain motion, which characterizes the phenomenon called damping.
By comparison, the tan delta peak, which is usually reported in the literature for Tg, best represents longer-range cooperative molecular motion which is consistent with rubbery flow, permanent deformation or both depending on molecular structure.
Figure 9 shows a plot overlay, which compares the loss modulus (E”) and tan delta of two different polymers: polystyrene and polycarbonate.
Loss modulus (E”) is a sensitive indicator of molecular differences and has proved very useful in failure investigations.
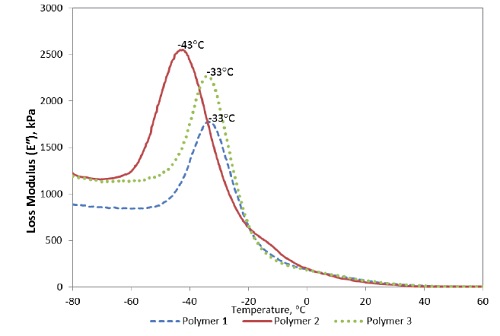
The plot in Figure 10 shows an overlay of E” curves of a failed elastomer and two controls of the same material. In this case, Polymer 2 was suspected of causing mechanical failure in a medical device. Polymers 1 and 3 represented the “good” controls, which met design specification and passed field tests, respectively. The E” peak maximum of Polymer 2 was significantly lower (-43°C) compared to the controls. The peak was also broader for Polymer 2. Consequently, Polymer 2 showed less resistance to motion at the onset of Tg, which strongly suggested a “looser” internal structure and/or the presence of plasticizers that led to larger rotational freedom. This higher “viscous” response was a strong indicator that the molecular structure of Polymer 2 lacked the resiliency of Polymers 1 and 3, which is the property needed for recovering shape after mechanical stress is applied.
VISCOELASTIC PROPERTIES AS A FUNCTION OF FREQUENCY
The case studies above demonstrated the effect of temperature on properties measured by DMA. A further consideration is the effect of changing the frequency of the applied sine wave cycle during the test. The rate of motion of the polymer chains not only depends on the thermal environment, it is also affected by the frequency of loading.
When holding the amplitude constant and increasing the frequency of the applied deformation, the molecular relaxations (e.g. E” and tanδpeak max) are observed at higher temperatures. This information is important for materials used in applications where exposure to multiple frequencies and operating temperatures is common, such as in mechanical belt drive systems.
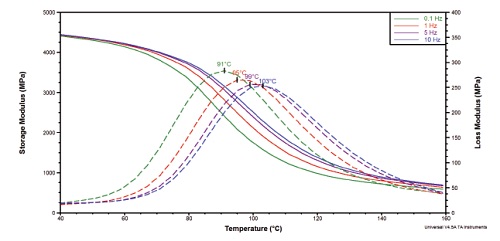
Figure 11 illustrates the frequency dependence of the storage modulus (E’) and tan delta of an oriented PET film. The Tg was calculated from the peak maximum in tan delta at each frequency (0.1, 1, 5 and 10 Hz). The difference in Tg measured at 10 Hz and 0.1 Hz was 12°C.
Another feature of DMA is the application called Time-Temperature Superposition (TTS). This technique is commonly used to predict viscoelastic behavior over a longer time or frequency range than can be conveniently measured in a testing lab. For example, consider the storage modulus of PET film measured at eight different frequencies in a frequency sweep under conditions of stepwise increase in temperature.
The resulting data (shown in Figure 12) can be used to generate a master curve for predicting the storage modulus at frequencies beyond he testing limits. To do so, a single reference temperature is selected from the data (e.g. 95°C) and the storage modulus (E’) values at this temperature for each frequency in the series (e.g. 20, 10, 5, 2, 1, 0.5, 0.2, 0.1 Hz) are constructed into a “reference data set” of E’ versus frequency. Then TTS mathematical processing is used to superimpose the remaining data sets onto the reference data, which constructs a master curve of (theoretical) storage modulus versus frequency.
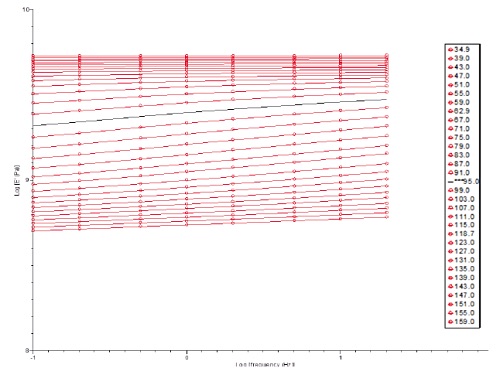
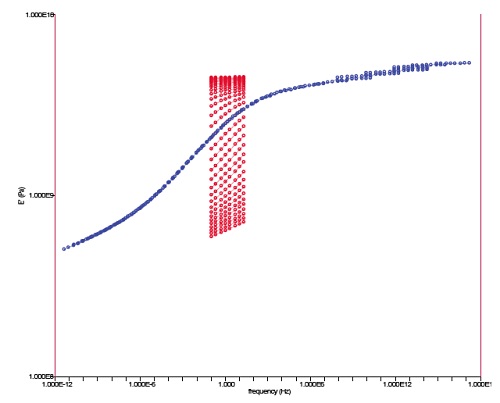
Figure 13 shows the master curve (in blue) and the unshifted data (in red), which are overlaid to illustrate the results obtained for the PET case study. As shown, the master curve projects the PET storage modulus over a dramatically wider frequency range than used for the experiment.
Although the preceding discussion of TTS was very simplified, the basic principles governing the technique are summarized by the following statements:
- Viscoelastic polymers have a special relationship between time (frequency) and temperature. Polymers relax or stiffen as a function of the thermal environment. They also relax or stiffen as a function of time.
- TTS takes advantage of this time-temperature “equivalency.” Viscoelastic properties change in the same manner at high temperatures as for long time periods (low frequency), and the properties change in the same manner at low temperatures as for short time periods (high frequency).
TRANSIENT EXPERIMENTS: CREEP AND STRESS RELAXATION TESTS BY DMA
Most standard DMA instruments are equipped to perform transient experiments, which involve applying a load to the specimen and monitoring its response over a specified time period. Two types of transient tests are used to study the viscoelastic response of polymers:
- Creep Test: a polymer specimen is subjected to a fixed load and the change in dimension is monitored as a function of time.
- Stress Relaxation Test: a polymer specimen is loaded to deform it by a fixed amount and the change in load to maintain that deformation is monitored as a function of time.
Creep testing is useful for measuring the amount of recoverable and non-recoverable strain after rapid and complete removal of the applied load. The recoverable strain depends on the elasticity of the polymer and the time scale of the experiment (as well as the thermal environment). Under isothermal conditions, the time dependency of viscoelastic response implies that the best approach is to apply the load until the material reaches a steady state, followed by instantaneous release of the load and allowing sufficient recovery time for the sample to reach a steady state.
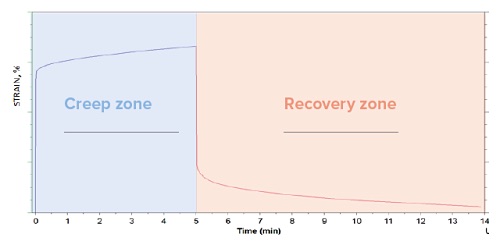
Figure 14 shows a graph of creep and recovery behavior of a polymeric material as a function of time. Activation of the instantaneous load on the material is represented by the steep linear portion of the curve at time ~ 0. The creep at load is shown over a 5 minute period (purple curve – creep zone). After subsequent release of the load, the strain in the material recovered for ≈ 9 minutes (red curve – recovery zone).
As shown, the polymer recovery had nearly reached steady state by the end of the experiment. Ideally, the recovery period should be extended until the slope is zero, which allows comparison of the ultimate recoverable and non-recoverable strain in the material.
Under isothermal conditions, application of a constant strain to a viscoelastic material will result in gradual loss of mechanical resiliency due to molecular relaxation. Therefore, it requires gradually lower force over time to maintain the strain at the fixed level. This property is called stress relaxation. Unlike creep in which the strain (dimension change) is monitored, a stress relaxation test tracks the decrease in stress under constant deformation.
Stress relaxation is important when polymeric parts are used to form a mechanical joint or seal, such as plastic compression fit fasteners and rubber flange gaskets. In such applications, it is important that the stresses induced by the connection do not result in loosening of the fitting. Stress relaxation experiments are designed to predict the loss of mechanical properties as a function of time, which is essential knowledge for material development and mechanical design.
Stress relaxation of polymers depends on temperature and the magnitude of the applied deformation (strain), as well as the time period of the test.
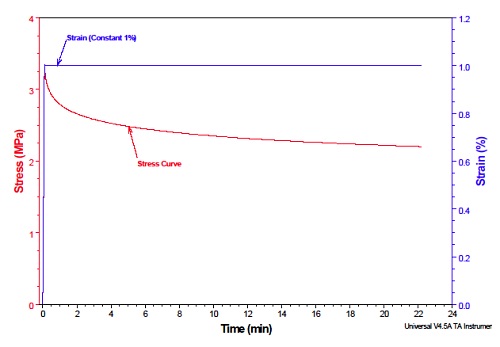
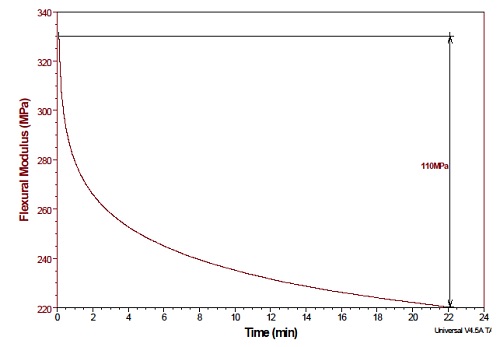
Figure 15 shows the stress relaxation curve for a polypropylene sample subjected to a 1% strain in cantilever bending mode at 25°C.
The flexural modulus was also calculated from the data (as plotted in Figure 16), which illustrates the decline in material stiffness over time. The plot shows that the flex modulus of polypropylene decreased by 110MPa over ≈22 minutes under the 1% strain.
Creep and stress relaxation properties are vital to material and engineering design because they are related to polymer molecular structure and associated chemistries in the formulation. The chemical aspects of polymer formulations affecting mechanical performance and design include:
- Polymer molecular weight (distribution)
- Inorganic fillers
- Plasticizers / slip agents
- Crosslinking (degree and type of)
- Crystallinity
- Orientation / alignment
- Molecular interactions
- Chain stiffness (single vs. double bonds, aliphatic vs. aromatic)
- Pendant groups / branching on polymer chains
- Interaction with small molecules (e.g. moisture or residual monomers)
- Impurities, defects, inclusions
- Chemical and physical aging (e.g. oxidation or degradation)
The demand for fast turnaround in design of new polymeric devices and materials necessitates quick completion of associated laboratory tests, which include mechanical characterization. Consequently, it would not be practical to perform multiple creep experiments on Polymer A using many different temperatures and time conditions. It certainly would be impracticable to compare Polymer A with a glass-fiber modified version of Polymer A in multiple temperature / time experiments. Fortunately, TTS can be applied to transient experiments for projecting long-term behavior using a few strategic experiments. Molecular relaxation and reorganization are gradual processes at low temperatures, but speed up significantly at higher temperatures. Therefore, relatively short-term experiments can be conducted at higher temperatures, after which TTS is applied to shift the experimental curves along the time axis. The resulting master curve extrapolates the data to predict the viscoelastic responses at longer time periods, which were not possible to measure experimentally.
An example TTS data manipulation is presented on the following page, which is based on data obtained under low shear stress using a mechanical analyzer equipped with a rotational rheometer. Although the equipment is not identical to DMA, which operates in linear mode on solid materials, the process of shifting the data is performed in exactly the same manner for both rheometer and DMA creep experiments.
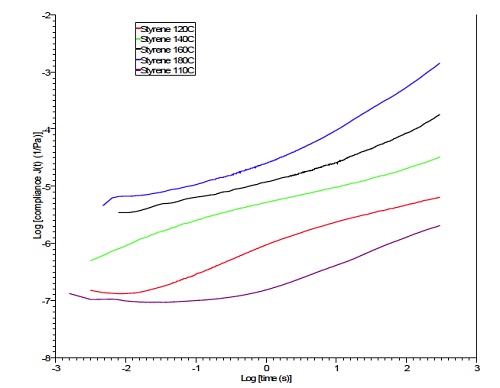
The example creep results were obtained for polystyrene using an applied shear stress for 10 minute periods (600 seconds) at five different temperatures (110, 120, 140, 160 and 180°C).
Figure 17 shows an overlay of the data for the five experiments: creep compliance [J(t)] versus time. Creep compliance has units of m2/N and is defined as J(t)=Strain/(Shear stress). The creep compliance at 140°C was selected as a reference curve, and TTS was used to shift the remaining four curves to the left and right of the reference curve.
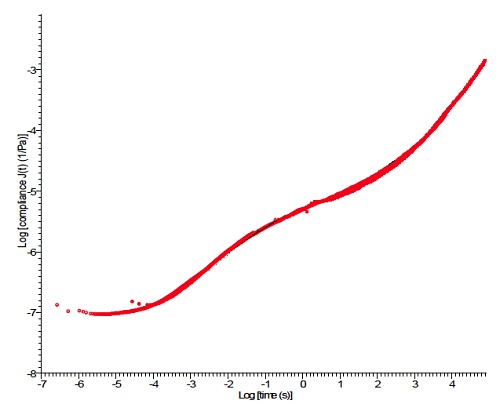
The master curve is shown in Figure 18, which is a log – log plot of creep compliance [J(t)] versus time. The scaling on the log time axis is seconds.
The master curve shows predictive compliance data that extends the time axis up to 105 seconds. This allows prediction of long term creep behavior at the chosen reference temperature (140°C in this example).
A time saving feature is the ability to select another temperature in the range used for the test and create a predictive master curve for the new temperature selection. This illustrates how TTS can save time and resources while projecting viscoelastic properties onto a longer time scale.
CONCLUSIONS
The above cases represent just an overview of the capabilities of DMA and how this tool provides rapid characterization of viscoelastic properties of polymeric materials. It should be mentioned that DMA often proves to be the most sensitive of the thermal analysis techniques for comparing properties and often serves as the best thermal analytical tool for failure analysis. Please contact EAG Laboratories for further information on using DMA for your polymer needs.
Would you like to learn more about Characterization of Polymers?
Contact us today for your characterization of polymers using DMA needs. Please complete the form below to have an EAG expert contact you.