Home » Electrochemical Impedance Spectroscopy (EIS)
Electrochemical Impedance Spectroscopy (EIS) is a non-destructive frequency‑domain analytical method used to evaluate electrochemical systems, including batteries and supercapacitors. It works by applying a small sinusoidal signal to the system and measuring its response across a broad frequency range. This technique reveals valuable information about internal resistance, charge‑transfer reactions, double‑layer behavior, ion‑diffusion processes, and various forms of battery degradation. EIS reveals both resistive and reactive (capacitive or inductive) components of the system.
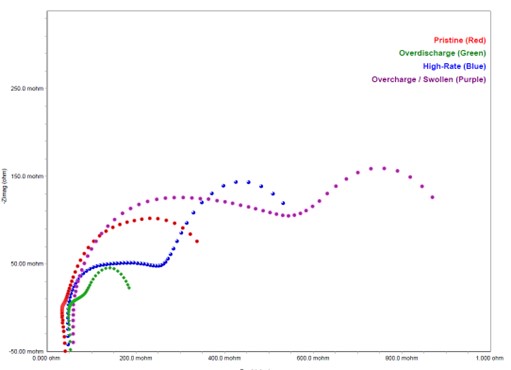
EIS results are most visualized using Nyquist and Bode plots. In a Nyquist plot, the real component of impedance (Z′) is plotted along the x‑axis, while the negative imaginary component (–Z″) is plotted on the y‑axis. This representation effectively highlights the characteristic time constants associated with different electrochemical processes within the system.
The Bode plot, on the other hand, presents both the impedance magnitude and the phase angle as functions of frequency. This format is useful for analyzing frequency‑dependent behavior, evaluating system stability, and identifying performance‑limiting processes in electrochemical and electronic systems.
Download the application note to learn more.
Nyquist plots of (i) pristine (reference) cell, (ii) high-rate cycled cell, (iii) overdischarged cell, and (iv) overcharged cell
Would you like to learn more about Electrochemical Impedance
Spectroscopy (EIS)?
Contact us today for your Electrochemical Impedance Spectroscopy (EIS) needs. Please complete the form below to have an EAG expert contact you.
To enable certain features and improve your experience with us, this site stores cookies on your computer.
Please click Continue to provide your authorization and permanently remove this message.