Sampling of Fe in CIGS Solar Cell Using Large Area SIMS
Home » Sampling of Fe in CIGS, Solar Cell Using Large Area SIMS
Impurities, such as Fe, Ni and Cr, can adversely affect the performance of a CIGS solar cell. It is therefore important to understand how impurity concentrations may vary from surface location to location. The Fe contamination for CIGS on steel substrate is a common problem. SIMS is often used to determine Fe concentrations and uniformity at different locations (X Y).
The lateral distribution of Fe in CIGS/steel substrate is often observed to be non-uniform. Fe data collected using typical SIMS analytical conditions can therefore be misleading due to non-representative sampling. A better SIMS sampling approach is needed to address this issue.
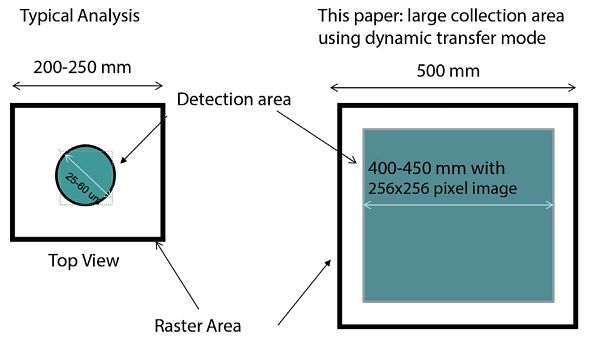
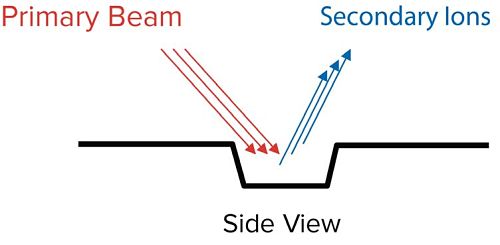
A primary beam of oxygen ions (O2+) is used in SIMS analysis of Fe in CIGS. The spot size of a focus primary beam is ~ 15 to 20 μm. The primary beam is rastered over a square area, typically 200-250 μm in width.
Secondary ions (Fe+) generated from the center portion of the rastered area are collected. In a SIMS instruments, secondary ions can be detected using either EM, FC or Ion Image.
RESULTS- FE IN CIGS/ STEEL FOIL
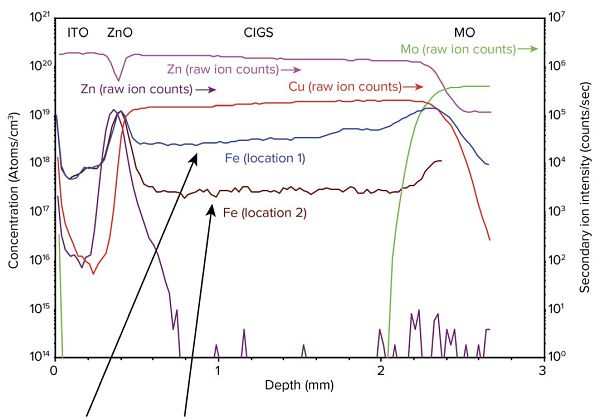
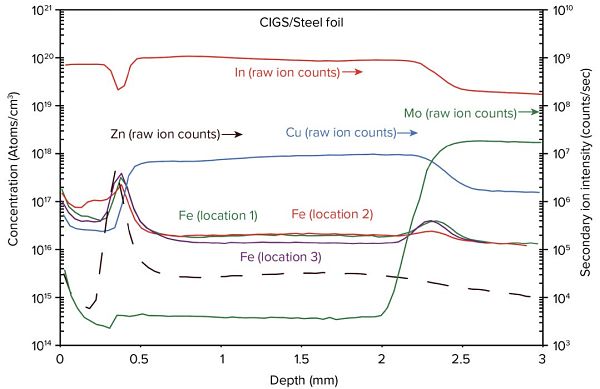
Under typical SIMS analysis conditions, with a data collection area of ~ 25 μm (in diameter), Fe concentrations often show large variation from location to location.
Fe profiles taken from two locations that are 300 μm apart – the difference in Fe concentrations is ~ 10x!
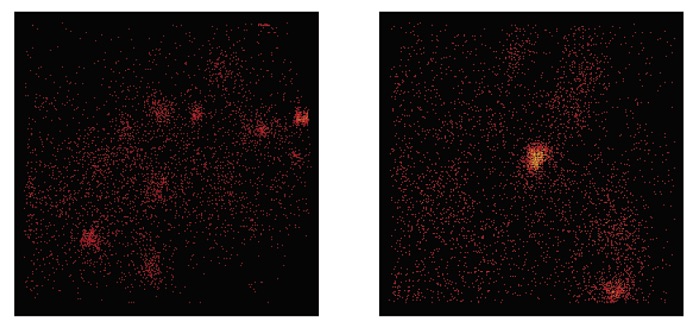
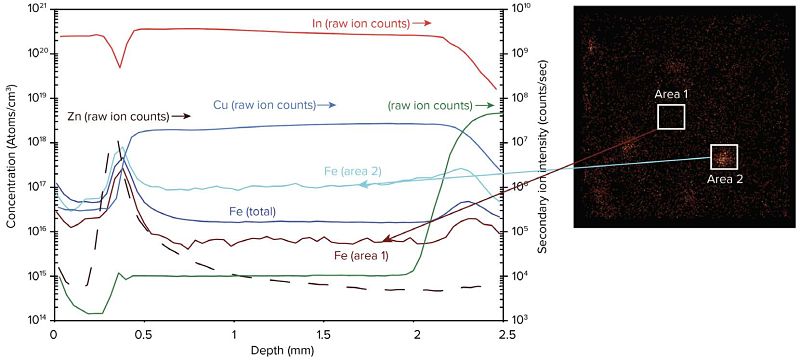
Figure 1: SIMS ion image of Fe: 450 x 450 mm area
In Figure 1 we show Secondary ion images of Fe in CIGS/Steel foil. Brighter spots represent higher Fe concentrations.
With a SIMS detection area of 25-60 μm, the Fe signal detected may not be representative of the average Fe concentration in the sample.
Solution: Large Collection Area
Fe profiles collected using a collection area of 400 x 400 μm at 3 separate locations approximately 1.5 mm apart show significantly less variation (<50%)
Solution: Large Area Image Depth Profiles and Selected Area Depth Profiles
SIMS image depth profiles show total Fe concentration from a 450 x 450 μm data collection area.
Selected Area Depth Profile from area 1 and area 2 (50 x 50 μm) illustrate the reason for large Fe concentration variation often observed in regular SIMS profiles.
SUMMARY
The lateral distribution of Fe in CIGS/steel foil is often observed to be non-uniform. Regular SIMS profile analysis may therefore not provide representative sampling. The use of a large collection area is shown to reduce the location to location variation significantly, providing a more representative sampling of the average Fe concentration in the sample.
Large area SIMS image depth profiles not only provides a large data collection area, but also ion images that show lateral distribution of impurities. Depth profiles can be re-constructed after analysis to provide variation of impurities at different locations.
Would you like to learn more about Sampling of Fe in CIGS Solar Cells?
Contact us today for your sampling of Iron in CIGS solar cells using large area SIMS. Please complete the form below to have an EAG expert contact you.
To enable certain features and improve your experience with us, this site stores cookies on your computer.
Please click Continue to provide your authorization and permanently remove this message.