Secondary Ion Mass Spectrometry (SIMS) Tutorial
Home » Secondary Ion Mass Spectrometry (SIMS) Tutorial
In this SIMS Tutorial from EAG Laboratories, we present the history of Secondary Ion Mass Spectrometry, as well as the scientific principles behind the instrumentation, theory and data provided by this analytical technique., as well as the scientific principles behind the instrumentation, theory and data provided by this analytical technique.
History
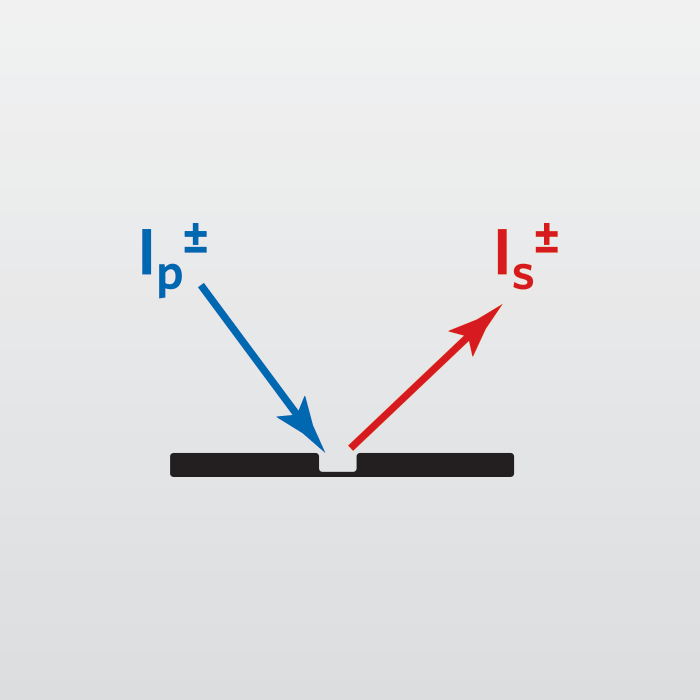
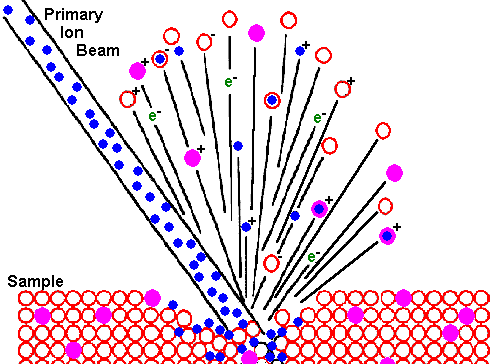
Bombardment of a sample surface with a primary ion beam followed by mass spectrometry of the emitted secondary ions constitutes secondary ion mass spectrometry (SIMS).
The first inklings of the SIMS process came when early mass spectroscopists noticed that ions from instrument construction materials were produced by ion sources. Later experiments extracted ions from the sources and accelerated them onto the sample, thereby producing the first SIMS primary ion beam. The first SIMS instrument was constructed under a NASA contract in the early 1960’s to analyze moon rocks. When it performed better than expected, exact copies of the prototype were introduced into the market place. The use of SIMS for materials characterization has grown steadily during the intervening 30 years.
SIMS measures trace levels of all elements in the periodic table. SIMS also provides lateral and depth distributions (microanalysis) of these elements within a sample. The electronic materials industries (semiconductors, optoelectric devices, etc.) are the largest users of SIMS. The geological community also uses SIMS for laterally resolved isotopic and elemental measurements.
SIMS Primary Ion Sources
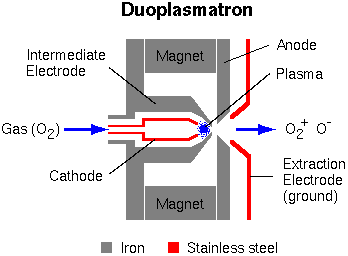
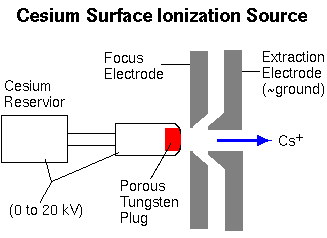
Typical SIMS instruments use either a duoplasmatron or a surface ionization primary ion source (or both).
The duoplasmatron can operate with virtually any gas, but oxygen is the most common because oxygen implantation into the sample surface enhances ionization efficiency for electropositive elements. Before this oxygen enhancement effect was discovered, argon was commonly used. The oxygen plasma within the duoplasmatron source contains both O– and O2+, and either can be extracted.
The cesium surface ionization source produces Cs+ ions as Cs atoms vaporize through a porous tungsten plug.
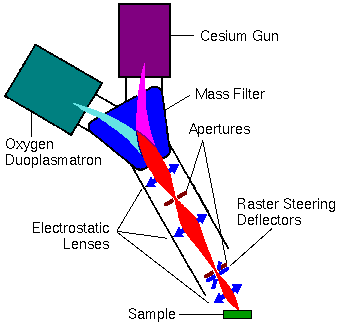
Primary Ion Column
Primary ions are extracted from the sources and passed to the sample through the primary ion column. The column usually contains a primary beam mass filter that transmits only ions with a specified mass-to-charge (m/z) ratio.
This mass filter eliminates impurity species in the beam. For example, Cr, Fe, and Ni ions sputter from stainless steel surfaces within a duoplasmatron. Without a primary beam mass filter, these metal contaminants deposit onto the sample surface, raising the detection limits for stainless steel elements.
In the figure below, the electromagnetically active components are shown in blue. The ion beam trajectories (indicated in red) are greatly exaggerated in the lateral directions.
The electrostatic lenses and the apertures control the intensity and width of the primary ion beam. Several aperture diameters are usually available at each aperture location. The primary beam intensity can be reduced by defocusing the ion beam onto the back of the first aperture (nearest the magnet). A narrow beam (at the sample) results from defocusing the ion beam (with the middle lens) onto the back of the second aperture, and then adjusting the last lens to transfer the image of the cross-over from behind the aperture onto the sample.
Electrostatic deflectors steer the primary beam in a raster pattern onto the sample. A finely focused and rastered primary ion beam delivers uniform primary beam intensity to an area on the sample. This leads to flat bottom sputter craters. The best depth resolution in a depth profile results when the secondary ions are sampled from the flat bottom of such a crater without contributions from the crater edges. Other deflectors (not shown) are located near the apertures. They help tune the primary beam through the middle of the electrostatic lenses.
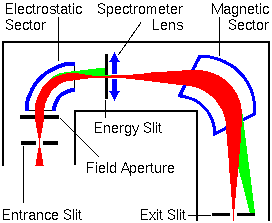
Secondary Ion Extraction and Transfer
Secondary ions are extracted from the sample as they are produced. If large mass spectrometer components are held at ground potential, the sample must be held at high voltage, the accelerating potential. The secondary ions accelerate toward the ground plate of an electrostatic lens. This first lens is called the immersion or ion extraction lens. The second (transfer lens) focuses the ion beam onto the mass spectrometer entrance slits or aperture. This two lens system constitutes an ion microscope. The secondary ions could be projected onto an image detector for viewing the sample surface. Different transfer lenses produce different magnifications.
In the figure below, the electromagnetically active components are shown in blue. The ion beam trajectories (indicated in red) are greatly exaggerated in the lateral directions.
The field aperture is located approximately at the point where the ion beam image comes into focus. The entrance aperture is sometimes called a contrast diaphragm. Smaller aperture diameters intercept ions with off-axis energy components. This reduces image aberrations but unfortunately it also reduces secondary ion intensity.
Ions that arise from off the secondary ion optical axis contribute to lower mass resolution. These off-axis ions arise because the primary beam raster pattern sputters an area rather than the single point where the axis intercepts the sample. The dynamic emittance deflectors adjust the secondary ion beam back on-axis. The deflectors operate in synchrony with the primary beam raster generator to provide continuous adjustment.
Ion Energy Analyzers
Electrostatic energy analyzers bend lower energy ions more strongly than higher energy ions. The sputtering process produces a range of ion energies. An energy slit can be set to intercept the high energy ions (shown in green).
In the figure below, the electromagnetically active components are shown in blue. The ion beam trajectories (indicated in red) are greatly exaggerated in the lateral directions.
Voltage offset is a strategy for enhancing monatomic ions over multiatomic. The monoatomic ions have higher energy distributions. If the accelerating voltage is lowered (offset), more of the atomic ions still have enough energy to pass through the energy slits. In a typical SIMS experiment, the accelerating voltage is 4.5 kV, and the offset is 50 V. The inner jaw of the slits intercepts most (low energy) multiatomic ions. Both monatomic and multiatomic ion intensities are reduced in a voltage offset measurement, but multiatomic ions relatively more than monoatomic.
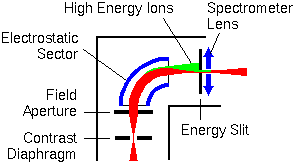
The inner and outer sector electrodes have voltages of opposite polarity. Their magnitude is about 10% of the ion accelerating voltage. The ion image comes into focus, producing a virtual image inside the electrostatic sector behind the field aperture. The active surfaces of the electrostatic sector are spherical. This geometry transfers the image to the mass analyzer with minimal distortion. The spectrometer lens adjusts the ion beam focus (cross over) to meet the input requirements of the mass analyzer.
Mass Analyzers
Dynamic SIMS instruments use two kinds of mass analyzers, magnetic sector and quadrupole. Magnetic sector instruments are most common. As the ion beam passes through the magnetic field, the particles are acted on by a force at right angles, both to the direction of motion and to the direction of the magnetic field. The following equation shows the relationship between the magnetic field (B), the ion accerating voltage (V), the mass-to-charge ratio (m/q), and the radius of ion curvature (r) in the magnetic field. In atomic units, m/q becomes m/z where z is the number of charges on the ion.
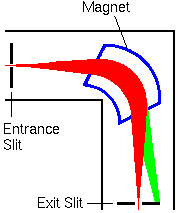
Magnetic sector mass analyzer is shown in blue. The ion beam trajectories (indicated in red) are greatly exaggerated in the lateral directions.
Modern mass spectrometers use non-normal pole faces for entrance and exit of the ion beam to the magnetic sector. The fringings fields in this configuration compress the ion beam in the vertical direction (in and out of the screen) as it passes through the sector. Fewer ions strike metal surfaces and the ion beam focuses better at the exit slit with non-normal pole faces. The entrance and exit slits can be arranged at ion beam crossovers for the cleanest separation (highest mass resolution) between ions with similar m/z values. The green part of the beam represents ions with higher m/z values that do not pass through the spectrometer.
The combination of a magnetic and an electrostatic sector produces a double focusing instrument. A magnetic analyzer, by itself, introduces chromatic aberrations into an ion beam with dispersed ion energies. These aberrations reduce mass resolution. In a series arrangement of one electrostatic and one magnetic sector, the energy dispersion of the electrostatic sector can just compensate the energy dispersion of the magnet.
The system will have the mass dispersive properties of the magnet, except that it will produce higher mass resolution. The spectrometer lens adjusts the cross-over from the electrostatic sector to the location required for the magnetic sector.
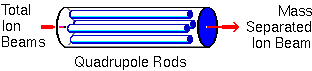
Quadrupole mass analyzers were invented in 1953. Many kinds of analysis, including SIMS, employ quadrupoles. Ideally, the rods have hyperbolic shapes, but this geometry can be approximated with closely spaced circular rods. In a typical quadrupole spectrometer, the rods are 1 cm in diameter and 20 cm long. In the diagram, ions enter from the left at a relatively low energy (~25 eV). Since SIMS ions can have a wider energy range than 25 eV, electrostatic sectors usually precede the quadrupole.
Alternating and direct voltages on the rods cause the ions to oscillate after entering the quadrupole. For a given set of voltages, Ions with a single mass-to-charge ratio undergo stable oscillation and traverse through the rods. All other ions have unstable oscillations and strike the rods. The alternating frequency and the ratio between the alternating and direct voltages remain constant. Scanning the voltages scans the mass spectrum.
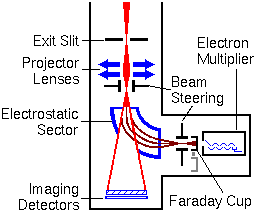
Secondary Ion Detectors
The most widely used SIMS instruments have as many as four detectors. These include an ion counting electron multiplier, a Faraday cup, and two ion image detectors. The following figure shows the arrangement of detectors. The ion counting electron multipliers are the most sensitive detectors. They must be protected from intense ion beams. The Faraday cup detector moves on a solenoid to cover the electron multiplier when the incoming ion signal is too high. High energy neutral species form by charge exchange when an ion beam strikes a surface. These neutrals contribute noise to the ion signal. If an electrostatic sector precedes the electron multiplier, the neutrals can be eliminated from the ion signal.
Quadrupole mass analyzers also use electrostatic sectors or deflectors to minimize the contributions of high energy neutral species to the ion signal. The ion beam passes through a small hole in the electrostatic sector when the sector is deactivated. This path leads to dual microchannel plate and resistive anode encoder image detectors. The projector lenses bring an image of the sample into focus on the image detectors.
Electromagnetically active components are shown in blue. The ion beam trajectories (indicated in red) are greatly exaggerated in the lateral directions. In particular, the image detectors are smaller and the path through the electrostatic analyzer is narrower. The ions pass through a much smaller hole in the sector.
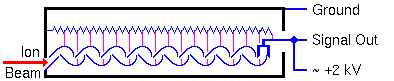
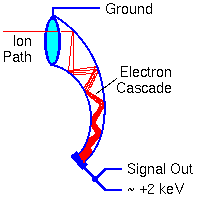
Electron Multipliers
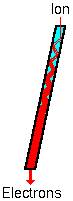
An electron multiplier consists of a series of electrodes called dynodes, each connected along a resistor string. The signal output end of the resistor string attaches to positive high voltage. The other end of the string goes to the electron multiplier case and ground.
The dynode potentials differ in equal steps along the chain. When a particle (electron, ion, high energy neutral, or high energy photon) strikes the first dynode it produces secondary electrons. The secondary electrons are accelerated into the next dynode where each electron produces more secondary electrons. A cascade of secondary electrons ensues. The dynode acceleration potential controls the electron gain.
Electron multipliers can also be made from continuous dynode materials rather than discrete dynodes. This glassy material contains lead that provides conductivity comparable to the resistor chain in the discrete dynode electron multipliers.
Most SIMS measurements use electron multipliers operating with sufficiently high gain to produce a detectable pulse for every ion arrival. Pulse counting is the most sensitive ion detection method. Detector noise arises from stray ions and cosmic rays, but these signals are normally less than one count per second.
In order to detect both positive and negative ions, the electron multiplier case stands at ground potential. The output end of the resistor chain must operate at high positive potential. This requires that the output pulse be capacitively coupled to the detector electronics. The detector electronics require a recovery time (dead time) after an ion arrival before a second ion can be detected. The detector dead time limits the measureable ion arrival rate to around 1e6 counts per second. Thus the electron multiplier dynamic range extends from below 1 to about 1e6 ion counts per second.
Pulse counting detectors follow Poisson statistics which require that each ion arrives independently of all other ions. A measurement consists of counting ions for a fixed period of time and the result takes the form of a counting number, n. The standard deviation of the measurement is equal to the square root of the number of counts. The second equation shows the standard deviation relative to the signal.
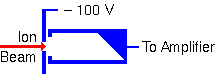
Faraday Cups
A Faraday cup is just an electrode from which electrical current is measured while a charge particle beam (electrons or ions) impinges on it. The shape helps minimize loss of secondary electrons that would alter the current measurement. A deep cup with an electron repeller plate minimizes secondary electron loss.
Ion Image Detectors
Ion image detectors depend on microchannel plate electron multiplier arrays. These plates consist of large arrays of small channel electron multipliers. SIMS instruments typically use round arrays with about 2000 channels across a diameter. Each channel is 10 microns in diameter. Channels are located on 12 micron centers and the total array is 25 mm in diameter.
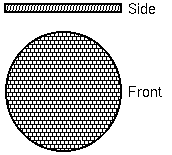
Each channel has dimensions of 10 x 400 micron. The channels are 7 degrees from perpendicular to the array surface. The voltage across single channel plate can produce gains has high as 1e5.
For SIMS use, two microchannel plates combine to easily produce gains of 1e6.
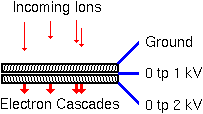
Two kinds of anode provide either direct visualization, or computer compatible ion position data. Two microchannel plates followed by a phosphor screen for visuallizing the electron cascade provides an easy way to monitor the secondary ion beam. SIMS analysts call this combination a dual microchannel plate (DMCP). As the electrons are accelerated into the phosphor anode, they generate more than one photon per electron. Thus, the anode provides
Related Instruments
Time-of-flight SIMS instruments are common. However, the sputtering duty cycle is low. A time-of-flight instrument is appropriate for static SIMS in contrast to dynamic SIMS. Only dynamic SIMS will be treated in this surface analysis tutorial because only dynamic SIMS yields quantitative information.
Theory
Today, SIMS is widely used for analysis of trace elements in solid materials, especially semiconductors and thin films.
The SIMS ion source is one of only a few to produce ions from solid samples without prior vaporization. The SIMS primary ion beam can be focused to less than 1 um in diameter. Controlling where the primary ion beam strikes the sample surface provides for microanalysis, the measurement of the lateral distribution of elements on a microscopic scale. During SIMS analysis, the sample surface is slowly sputtered away. Continuous analysis while sputtering produces information as a function of depth, called a depth profile. When the sputtering rate is extremely slow, the entire analysis can be performed while consuming less than a tenth of an atomic monolayer. This slow sputtering mode is called static SIMS in contrast to dynamic SIMS used for depth profiles. Shallow sputtering minimizes the damage done to organic substances present on the sample surface. The resulting ion fragmentation patterns contain information useful for identifying molecular species. Only dynamic SIMS will be treated in this surface analysis computer aided instruction package because only dynamic SIMS yields quantitative information.
Bombardment of a sample surface with a primary ion beam followed by mass spectrometry of the emitted secondary ions constitutes secondary ion mass spectrometry (SIMS).
The best SIMS reference is Secondary Ion Mass Spectrometry: Basic Concepts, Instrumental Aspects, Applications, and Trends, by A. Benninghoven, F. G. Rüdenauer, and H. W. Werner, Wiley, New York, 1987 (1227 pages).
Ion Beam Sputtering
The bombarding primary ion beam produces monatomic and polyatomic particles of sample material and resputtered primary ions, along with electrons and photons. The secondary particles carry negative, positive, and neutral charges and they have kinetic energies that range from zero to several hundred eV.
Primary beam species useful in SIMS include Cs+, O2+, O, Ar+, and Ga+ at energies between 1 and 30 keV. Primary ions are implanted and mix with sample atoms to depths of 1 to 10 nm.
Sputter rates in typical SIMS experiments vary between 0.5 and 5 nm/s. Sputter rates depend on primary beam intensity, sample material, and crystal orientation.
The sputter yield is the ratio of the number of atoms sputtered to the number of impinging primary ions. Typical SIMS sputter yields fall in a range from 5 and 15.
Sputtering Effects
The collision cascade model has the best success at quantitatively explaining how the primary beam interacts with the sample atoms. In this model, a fast primary ion passes energy to target atoms in a series of binary collisions. Energetic target atoms (called recoil atoms) collide with more target atoms.
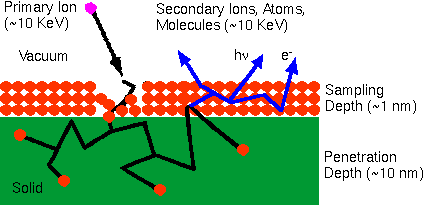
Target atoms that recoil back through the sample surface constitute sputtered material. Atoms from the sample’s outer monolayer can be driven in about 10 nm, thus producing surface mixing. The term knock-on also applies to surface mixing.
Sputtering leads to surface roughness in the sputter craters. Lattice imperfections, either already present or introduced by surface mixing, can be germs for roughness that takes the form of ribbons, furrows, ridges, cones, and agglomerations of cones. Polycrystalline materials form rough crater bottoms because of differential sputter rates that depend on crystal orientation.
Secondary Ion Energy Distributions
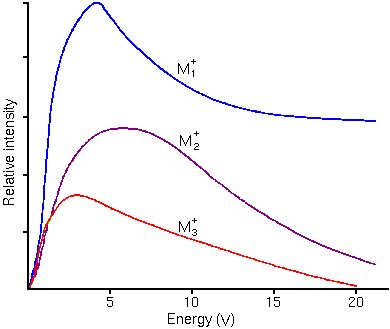
The sputtering process produces secondary ions with a range of (translational) kinetic energies. The energy distributions are distinctly different for atomic and molecular ions. Molecular ions have relatively narrow translational energy distributions because they have kinetic energy in internal vibrational and rotational modes whereas atomic ions have all kinetic energy in translational modes. The following figure shows typical energy distributions for mono, di, and triatomic ions.
Secondary Ion Yields - Elemental Effects
The SIMS ionization efficiency is called ion yield, defined as the fraction of sputtered atoms that become ionized. Ion yields vary over many orders of magnitude for the various elements. The most obvious influences on ion yield are ionization potential for positive ions and electron affinity for negative ions. For example, the following figure shows the logarithm of positive ion yields plotted as a function of ionization potential. The ion yields are relative to silicon in a silicon matrix with oxygen sputtering.
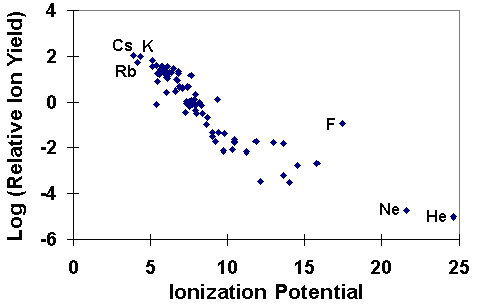
The correlations of ionization potential with secondary ion yields are not perfect. Variations depend both on the sample matrix and on the element itself. For example, the presence of oxygen in the sample enhances positive ion yields for most elements, but fluorine exhibits anomalously high positive ion yields in nearly all samples. Some elements, such as helium and neon fall outside the trend shown in the picture.
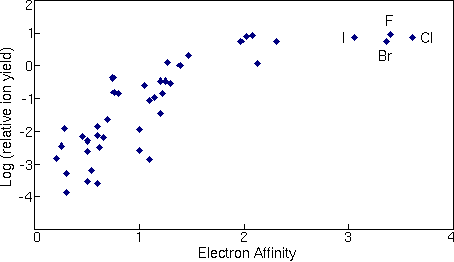
The next figure shows a similar treatment for negative ions where the logarithms of relative ion yields are plotted against electron affinities. The ion yields are relative to silicon for measurements in a silicon matrix with cesium ion sputtering. The four halides are the elements that deviate furthest from the trend line.
Secondary Ion Yields - Primary Beam Effects
Other factors affect the secondary ionization efficiencies in SIMS measurements. Oxygen bombardment increases the yield of positive ions and cesium bombardment increases the yield of negative ions. The increases can range up to four orders of magnitude.
Oxygen enhancement occurs as a result of metal-oxygen bonds in an oxygen rich zone. When these bonds break in the ion emission process, the oxygen becomes negatively charged because its high electron affinity favors electron capture and its high ionization potential inhibits positive charging. The metal is left with the positive charge. Oxygen beam sputtering increases the concentration of oxygen in the surface layer.
The enhanced negative ion yields produced with cesium bombardment can be explained by work functions that are reduced by implantation of cesium into the sample surface. More secondary electrons are excited over the surface potential barrier. Increased availability of electrons leads to increased negative ion formation.
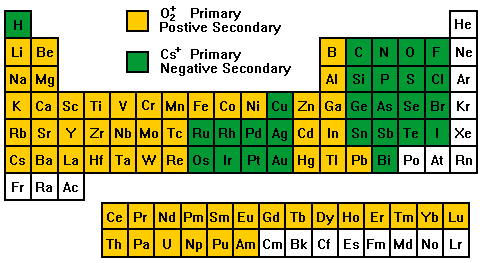
The variability in ionization efficiencies leads to different analysis conditions for different elements as indicated on the periodic table.
Relative Sensitivity Factors
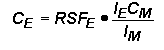
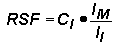
Quantitative analysis by SIMS uses relative sensitivity factors defined according to the following equation.

The major (or matrix) element is usually chosen as the reference. Substituting M (matrix) for R (reference) and rearranging gives the following equation.
In trace element analysis, we can assume that the matrix elemental concentration remains constant. The matrix concentration can be combined with the elemental RSF to give a more convenient constant, RSF.
This RSF is a function of the element of interest and the sample matrix.
Note that RSF and CE have the same concentration units. This is the most common form of the RSF equation.
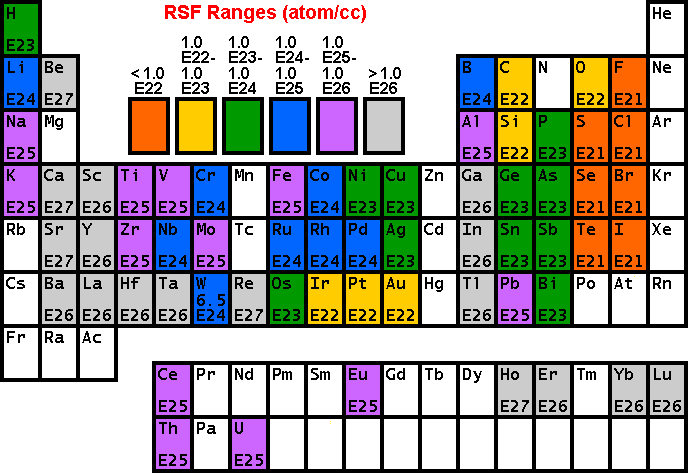
RSF Tables
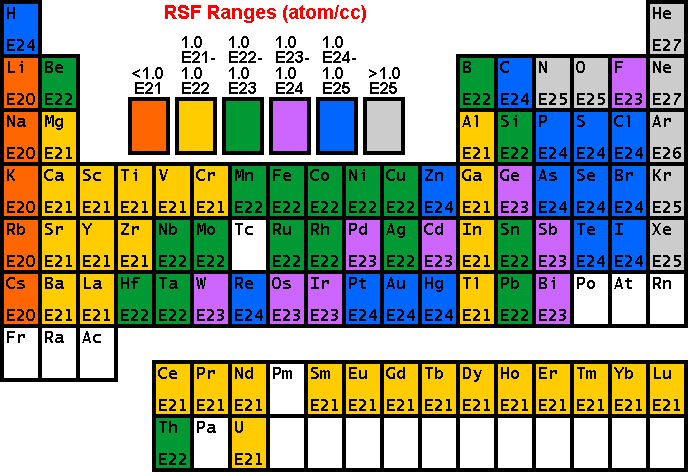
The following tables of RSF values (from R.G. Wilson, Int. J. Mass Spectrometry. Ion Proc., 143, 43, 1995) show how sensitivity depends on the element of interest. Low RSFs mean high sensitivity. Note that modest concentrations of high sensitivity elements can saturate electron multiplier ion detectors.
Sensitivity and Detection Limits
The SIMS detection limits for most trace elements are between 1e12 and 1e16 atoms/cc. In addition to ionization efficiencies (RSF’s), two other factors can limit sensitivity. The output of an electron multiplier is called dark counts or dark current if no secondary ions are striking it. This dark current arises from stray ions and electrons in instrument vacuum systems, and from cosmic rays. Count rate limited sensitivity occurs when sputtering produces less secondary ion signal than the detector dark current. If the SIMS instrument introduces the analyte element, then the introduced level constitutes background limited sensitivity. Oxygen, present as residual gas in vacuum systems, is an example of an element with background limited sensitivity. Analyte atoms sputtered from mass spectrometer parts back onto the sample by secondary ions constitute another source of background. Mass interferences also cause background limited sensitivity.
Depth Profiling
Monitoring the secondary ion count rate of selected elements as a function of time leads to depth profiles. The following figure shows the raw data for a measurement of phosphorous in a silicon matrix. The sample was prepared by ion implantation of phosphorous into a silicon wafer. The analysis uses Cs+ primary ions and negative secondary ions.
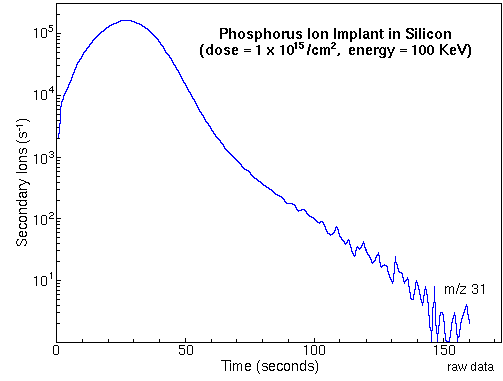
To convert the time axis into depth, the SIMS analyst uses a profilometer to measure the sputter crater depth. A profilometer is a separate instrument that determines depth by dragging a stylus across the crater and noting vertical deflections. At the end of the above phosphorous depth profile, profilometry gives 0.74 um for the crater depth. Total crater depth divided by total sputter time provides the average sputter rate.
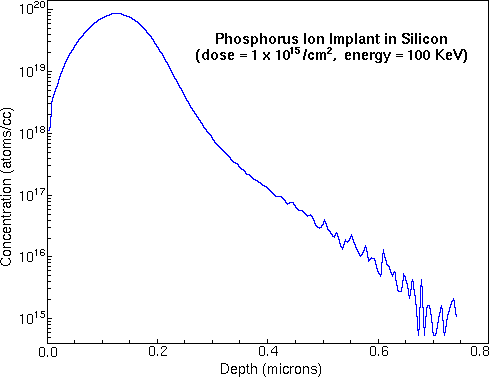
Relative sensitivity factors (RSFs) convert the vertical axis from ion counts into concentration. The appropriate RSF value for the above phosphorous implant is 1.07E23 atoms per cubic centimeter and the matrix current (IM) is 2.2E8 silicon ion counts per second. The following figure shows the above phosphorous depth profile plotted on depth and concentration axes.
Depth Resolution
Depth resolution depends on flat bottom craters. Modern instruments provide uniform sputter currents by sweeping a finely focused primary beam in a raster pattern over a square area. In some instruments, apertures select secondary ions from the crater bottoms, but not the edges. Alternatively, the data processing system ignores all secondary ions produced when the primary sputter beam is at the ends of its raster pattern.
Standards for RSF Measurement
Quantitative SIMS analysis requires standard materials from which to measure RSF values. Because ion yields depend on the analyte element, the sputtering species, and the sample matrix, separate RSF’s must be measured for each. Ion implants are good standards. It is possible to implant virtually any element into any matrix. Ions can be passed through a mass analyzer before implantation to insure implant purity. Typical implant ion energies range from 50 to 300 keV. Higher energies are usually used for heavier ions, producing typical implant depths centered around 0.2 um. Most importantly, the implant ion current can be integrated to determine total ion dose. However, care must be taken to exclude secondary electron and ion currents from the total measurement.
The phosphorous implant raw data shown in the Depth Profile section can be used to calculate an RSF value for phosphorous in silicon. The shaded area is the total signal from the phosphorous implant (3.68e6 phosphorous ions).
Dividing the total signal by the measurement time gives Ii, the average phosphorous secondary ion signal during the measurement (2.69e4 / s). The implant dose (1e15 ions per square centimeter in this example) and the crater depth (0.74 um) are required to calculate the average implant concentration, CI (1.35e19 atom/cc).
Inclusion of the silicon matrix current, IM, (2.18E8 / s) provides for RSF calculation according to the rearranged RSF equation.
The calculated RSF value (1.09e23) is in close agreement with the value cited (1.07e23) in the RSF Tables section.
Bulk Analysis
For samples with homogeneously dispersed analyte, bulk analysis provides better detection limits than depth profiling, usually by more than an order of magnitude. Faster sputter rates increase the secondary ion signal in bulk analysis. The fastest possible sputtering requires intense primary ion beams which sacrifice depth resolution because they cannot be focused as required for flat bottom (rastered) craters. Otherwise, bulk analyses are similar to depth profiles. Ion intensity data are displayed as a function of time. This provides a means for verifying that the sample is indeed homogenous. In a typical heterogeneous sample, the analyte is concentrated in small inclusions that produce spikes in the data stream.
Mass Spectra
Mass spectra sample the secondary ions in a preselected mass range by continuously monitoring the ion signal while scanning a range of mass-to-charge (m/z) ratios. The mass analyzer can be either a magnetic sector or a quadrupole. The mass spectrum detects both atomic and molecular ions. Secondary ions containing more than one atom are called molecular ions in SIMS. Note that the term molecular ion also finds use in organic mass spectrometry where it refers to the parent ion before any fragmentation. The mass analyzer must be scanned in small steps to insure that all mass-to-charge (m/z) ratios are sampled. Ten steps per mass unit are common. At higher mass resolution, ten mass increments per peak width adequately define the peak shape.
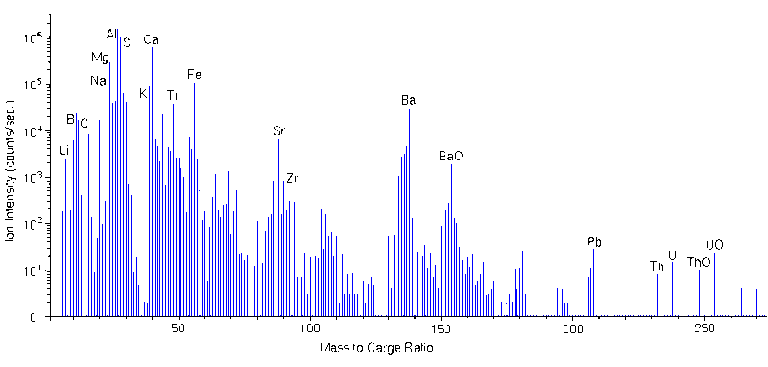
A mass spectrum with a mass range of 100 has at least 1000 data channels for which a reasonable analysis time is 0.1 s per channel. The following figure shows a compressed mass spectrum for a coal fly ash particle. The spectrum clearly shows Li, Be, B, C, O, Na, Mg, Al, Si, K, Ca, Ti, Fe, Zr, Ba, Pb, Th, U. Notable molecular ions include TiO, FeO, BaO, ThO, and UO at m/z 64, 72, 154, 248, and 254, respectively. The ion intensities reflect the isotopic abundances of the elements. For example, silicon isotopes intensities at m/z 28, 29, and 30 parallel the relative silicon natural abundances 92.2 : 4.7 : 3.1. Note the peak for doubly charged Ca++ at m/z 20.
Mass Interferences
Mass interferences occur whenever another ion has the same nominal mass as the analyte ion. Such interferences are called isobaric. During the analysis of iron in silicon for example, 28Si2+ interferes because it has the same mass (m/z 56) as 56Fe+. Oxides are common interferences since oxygen-metal bonds are particularly stable. Thus, 40CaO+ can also interfere with 56Fe+ measurements. Low intensity hydrides of many elements appear one mass unit higher than the elements themselves. A good example is silicon-30 hydride (30SiH+) which interferes with trace phosphorous analysis. Primary ions often combine with sample elements to produce interferences. For example 133Cs32S2- is isobaric with Au- (m/z 197) during the measurement of gold in pyrite (FeS2).
High Mass Resolution
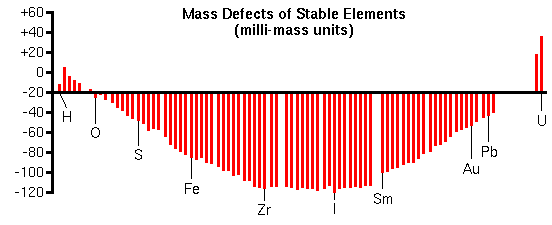
Although analyte/interference pairs have the same nominal masses, their exact masses differ by a fraction of a mass unit. The exact mass minus the nominal masses is called the mass defect. Mass defects arise from differences in the nuclear binding energies that hold the protons and neutrons together in the nucleus. Mass defects vary from +0.0078 for hydrogen to 0.1 for elements in the middle of the periodic table to +0.051 for uranium.
The curve of mass defects gives atomic ions higher masses than molecular interferences at relatively low masses and the opposite at higher masses.
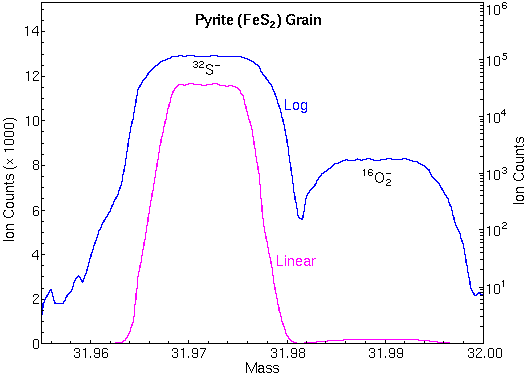
The following mass spectrum in the m/z 32 region shows separation of 32S and 16O2.
Mass spectrometers with sufficient mass resolution can separate atomic ions from molecular ion interferences. Mass resolution is usually specified in terms of m/delta m where m is the nominal mass of the two ions and delta m is their difference.
For example, 56Fe and 28Si2 (m/z 55.9349 and 55.9539) require m/delta m 5,600 for separation while Au and 133Cs32S2 (m/z 196.9666 and 196.8496) require m/delta m 1700. These two isobaric pairs illustrate the tendency for atomic ions to have lower masses than molecular interferences at relatively low masses and the opposite at higher masses.
Each different kind of SIMS mass analyzers has a range of possible mass resolutions. For example, a (well tuned) double focusing magnetic sector instrument can have mass resolution in the range m/delta m 500 to 10,000. Loss of secondary ion intensity accompanies operation at the high end of the mass resolution range.
Minor Isotopes
Minor isotopes can often resolve interference problems. However, minor isotope secondary ion intensities are lower (by the isotope ratio), detection limits are correspondingly higher (worse), and the RSF values must be adjusted (up). For example, measurement of iron using the 54Fe isotope avoids the interference of 28Si2 with 56Fe, but the 54Fe signal intensity is lower than 56Fe by the 54Fe/56Fe isotope ratio (0.0645). Natural abundance isotope ratios cannot always be used for these adjustments because some processes, such as ion implantation of a specific isotope, alter the ratios.
Elemental Interferences
In a few cases, an isotope of one element has the same nominal mass as an isotope of another. Their separation requires ultra-high mass resolution, beyond the capability of any commercial SIMS instrument. For example, 104Ru and 104Pd would interfere with each other and require m/delta m ~75,000 to separate. Fortunately, non-interfering isotopes are available for most elemental interferences.
Voltage Offset
Sputtering produces secondary ions with a distribution of energies. The voltage offset technique uses the energy analyzer of a mass spectrometer to select secondary ions from the high range of translational energies. The offset is simply a reduction in acceleration voltage. The energy analyzer deflects lower energy ions by a larger angle. A physical barrier (the inner jaw of the energy slit) intercepts the low energy ions. Ions that started with higher translational energies pass through to the mass analyzer. Voltage offset thus discriminates against molecular interferences relative to atomic species. The operator selects the energy cutoff point. A 30 V offset would eliminate essentially all of the di and triatomic ions from a typical distribution of energies.
There is an analytical trade-off for this reduction of isobaric interferences. Most of the monatomic ions are also eliminated. A 30 V offset typically reduces the monatomic ion intensity by a factor of ten. The analyst must decide whether this reduction of the analyte signal is tolerable.
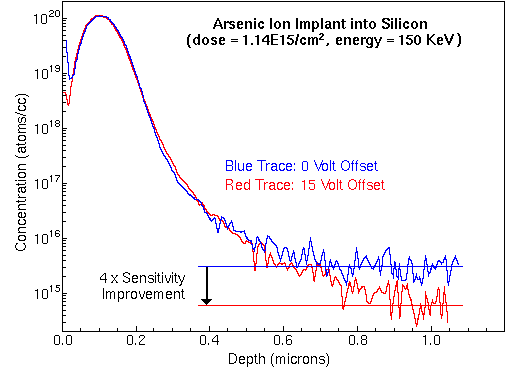
Reduction of analyte signal intensity can usually be compensated by changing other experimental parameters, higher primary beam current or wider spectrometer slits, for example. The following figure shows the analysis of arsenic in silicon, both with and without voltage offset. A small interfering signal from 28Si30SiOH falls at m/z 75. Note the improved detection limits with 15 volt offset.
Sample Charging
The SIMS primary ion beam, secondary ions, and secondary electrons produce a net electric current at the sample surface. If the sample material conducts, the current flows through the sample into the instrument. However, insulating samples undergo charge buildup. Sample charging diffuses the primary beam and diverts it from the analytical area, often eliminating the secondary ion signal entirely. Sample charging also changes the energy distribution of the secondary ions, which effects their transmission and detection by the mass spectrometer. When the sample is a thin dielectric on a conducting substrate, a strong electric field develops. Mobile ions such as sodium and lithium migrate in the electric field and depth profiles no longer reflect the original compositions of the layers. Several techniques are available to manage sample charging, and they are often used in combination.
Electron Bombardment
Electrons compensate for positive charge buildup that results from positive primary ions and/or negative secondary ions and electrons. Low energy electron beams work better because higher energies produce more than one secondary electron for every incoming electron. Low energy electron beams are more easily implemented in quadrupole SIMS instruments, making quadrupoles the system of choice for insulating materials. In contrast to quadrupoles, magnetic sector instruments maintain the sample at high positive potential for positive ion spectroscopy, making it difficult to bring in a low energy electron beam. High energy electron beams, though less effective, are widely used.
Adjacent Conductors
Conducting grids placed over the sample reduce the effects of charging on ion optics and bring a source of electrons near to positively charged areas of the sample. When struck by a primary ion, the conductors emit secondary electrons that migrate to the charging area. Similarly, samples are often coated with conducting materials such as gold or carbon. Before starting the analysis, the coating must be sputtered away, but only in the analytical area.
Negative Primary Ion Beams
The most common negative primary ion beam is O, available from the same duoplasmatron sources that more commonly produce O2+. Primary O beams find wide use for insulating geological samples.
Automatic Voltage Offset
A continuously variable voltage offset can be applied to the accelerating voltage for samples that are only slightly charging. Automatic voltage offset procedures (called autovolt) are often incorporated into instrument control software. After every cycle in a depth profile analysis, the software invokes an energy distribution measurement and adjusts the voltage offset as needed to keep the peak of the distribution constant.
Ion Imaging
Ion images show secondary ion intensities as a function of location on sample surfaces. Image dimensions vary from 500 um to less than 10 um. Ion images can be acquired in two operating modes, called ion microscope or stigmatic imaging, and ion microbeam imaging or raster scanning. Ion microscopy requires a combination ion microscope/mass spectrometer capable of transmitting a mass selected ion beam from the sample to the detector without loss of lateral position information. Image detectors indicate the position of the arriving ions. Ion microscope images are usually round because the ion detectors are round. Lateral resolutions of 1 um are possible. A SIMS analyst selects images with higher lateral resolution at the expense of signal intensity and higher mass resolution at the expense of image field diameter.
For ion microbeam imaging, a finely focused primary ion beam sweeps the sample in a raster pattern and software saves secondary ion intensities as a function of beam position. Microbeam imaging uses standard electron multipliers and image shape follows raster pattern shape, usually square. Lateral resolution depends on microbeam diameter and extends down to 20 nm for liquid metal ion guns. Some instruments simultaneously produce high mass resolution and high lateral resolution. However, the SIMS analyst must trade high sensitivity for high lateral resolution because focusing the primary beam to smaller diameters also reduces beam intensity.
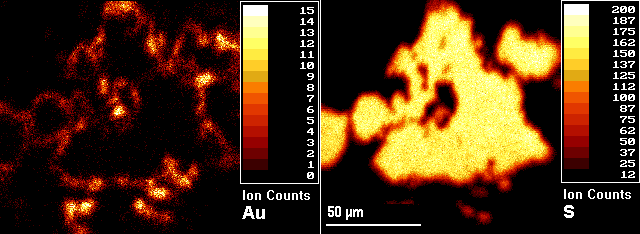
The example (microbeam) images show a pyrite (FeS2) grain from a sample of gold ore with gold located in the rims of the pyrite grains. The image on the right is 34S and the left is 197Au. The numerical scales and the associated colors represent different ranges of secondary ion intensities per pixel.
Three-dimensional analyses are possible by acquiring images as a function of sputtering time (image depth profiles). Microscope sputtering rates exceed microbeam rates, often by several orders of magnitude.
Thus microscope imaging produces depth scales more compatible with the scale of the lateral images. Microbeam imaging usually provides a better combination of image features, except when faster sputtering is required for three-dimensional analysis or for removing an overlayer before image acquisition.
Isotope Ratio Measurements
Isotope ratio measurements are operationally similar to depth profiles except that precision and accuracy requirements are higher. Since all of the isotopes of an element have the same chemical properties, ionization and detection efficiencies remain nearly constant for the different isotopes. Precisions of 0.1% are commonplace and accuracies approach precisions. Error analysis indicates that the precisions are limited mainly by Poisson counting statistics.

To attain these accuracies, SIMS instruments must be carefully tuned, and interferences must be eliminated. Mass spectral peaks should have flat tops and steep sides so that slight magnet instability does not change the ion signal intensity. The figure shows the necessary flat top peaks and the high mass resolution used for elimination of O2 interferences at m/z 32. Both were necessary for measuring accurate 34S/32S isotope ratios.
The ratio of isotope signal intensities must be corrected for slight variations in detection efficiency at different masses, and for slight variations that depend on signal intensity. These corrections are usually larger than the range of expected isotope ratios.
Would you like to learn more about Secondary Ion Mass Spectrometry (SIMS)?
Contact us today for your Secondary Ion Mass Spectrometry (SIMS) needs. Please complete the form below to have an EAG expert contact you.