XPS provides chemical bond information
Home » XPS provides chemical bond information
XPS (X-ray Photoelectron Spectroscopy) is also sometimes called ESCA (Electron Spectroscopy for Chemical Analysis). The biggest unique feature of the measurement method is that the chemical state of the species present can be determined or estimated from the measured chemical shift of the binding energy of each element.
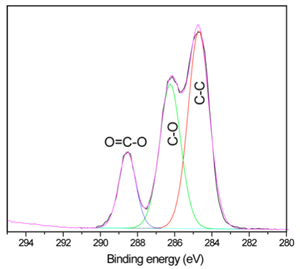
Electrons from a given elements each have slightly varying binding energies depending on the chemical bonding with neighboring atoms and the valence of these atoms. For example, the binding energy of C 1s electrons is larger for a C=O double bond than it is for a C-O single bond. Oxygen having a higher electronegativity than carbon causes a slight positive charge on the carbon atom.
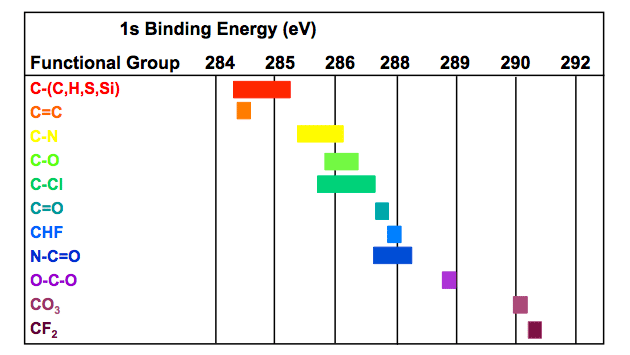
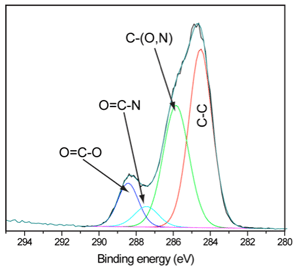
The slight positive charge on carbon causes the carbon electrons to be more strongly held to the atom and consequently the electrons are more difficult to remove and hence have a higher binding energy. For a C-O single bond a chemical shift of ~1.5 eV is observed relative to C-C. For a C=O double bond a slightly larger positive charge exists on the carbon atom and a chemical shift of ~2.9 eV is observed. Fluorine is much more electronegative than oxygen and causes larger chemical shifts. A C-F single bond has a chemical shift of ~2.9 eV whereas for C-O the shift is only ~1.5 eV. Conversely nitrogen is less electronegative than oxygen and a C-N single bond has a chemical shift of ~1.0 eV.
We show some examples of the different binding energies of carbon 1s electrons in different chemical environments.
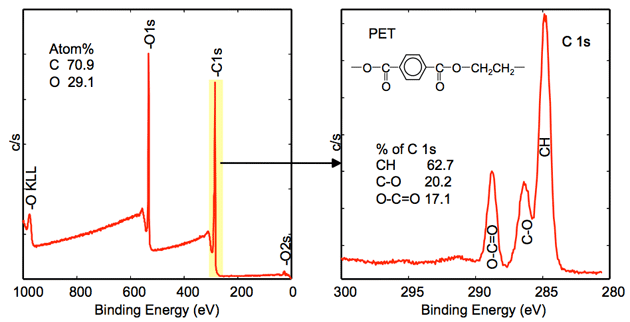
XPS spectrum of polyethylene terephthalate (PET)
Survey analysis (wide energy range)
Identification and quantification of elements (C, O) present on the surface
High resolution analysis (narrow energy range)
The chemical states of carbon can be seen from C1s peak positions. The relative amount of each chemical state is obtained from the relative peak intensities.

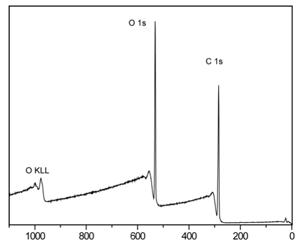
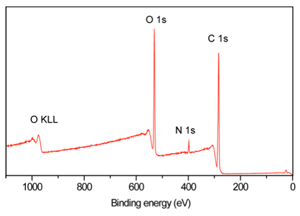
Analysis of contact lens additives
| Lens Material | C | N | O |
|---|---|---|---|
| pHEMA lens | 69.1 | 0.0 | 30.9 |
| pHEMA + PVP lens | 78.5 | 2.5 | 19.0 |
| pHEMA(theory) | 66.7 | 0.0 | 33.3 |
| PVP(THEORY) | 75.0 | 12.5 | 12.5 |
Would you like to learn more about XPS chemical bond information?
Contact us today for your XPS chemical bond information needs. Please complete the form below to have an EAG expert contact you.