APT Webinar
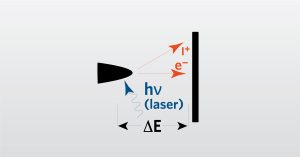
In this webinar we introduce Atom Probe Tomography (APT) which is a technique that provides three-dimensional (3D) chemical and spatial maps.

In this webinar we introduce Atom Probe Tomography (APT) which is a technique that provides three-dimensional (3D) chemical and spatial maps.

Graphite is and has been a ubiquitous mineral in our lives, from pencil “lead” and water filters to ancient markings on pottery.
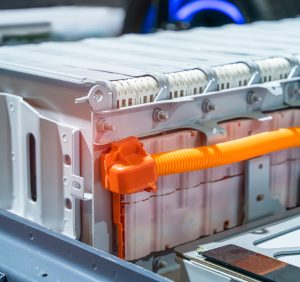
EAG scientists are leaders in the lithium-ion batteries recycling arena. EAG is a valuable resource in understanding these materials.

Women in STEM Career Fair Eurofins EAG Laboratories is excited to host a Women in STEM Career Fair on March 31st from 3 PM – 6 PM ET! We’re looking
To enable certain features and improve your experience with us, this site stores cookies on your computer. Please click Continue to provide your authorization and permanently remove this message.
To find out more, please see our privacy policy.