SIMS Analysis of Nitrogen in Silicon Carbide Using Raster Change Technique
Home » SIMS Analysis of Nitrogen in Silicon Carbide Using Raster Change Technique
Today’s state of the art silicon carbide (SiC) growth can produce semi-insulating crystals with a background doping around 5×10¹⁵ atoms/cm3 or lower. It is essential to have an accurate measurement technique with low enough detection limit to measure low level nitrogen concentration. Current SIMS detection limit of low E15 atoms/cm3 will provide accurate determination for nitrogen doping level of 5E16 at/cm3 or higher. In order to determine the lower nitrogen concentration, it is necessary to provide a better detection limit and to separate the contribution of background nitrogen properly.
The “raster changing” method provides an accurate way to determine and remove contribution of background nitrogen to the signal, because secondary ion intensities and matrix ion intensities can be analyzed at the same location of the sample by changing the primary beam raster size during a profile. In this study we have succeeded in applying the raster changing method to (a) N in the SiC substrate located under an SiC epi layer, and (b) the detection of N as low as 3E14/ cm3 a bulk-doped SiC substrate.
INTRODUCTION
Due to its unique capabilities of high detection sensitivity for a variety of elements under depth profiling mode, Secondary Ion Mass Spectrometry (SIMS) is an essential tool for characterization of dopants and impurities in SiC material.
Nitrogen, which is a shallow donor in SiC, is present as a trace impurity in all SiC wafers and epi-layers. Depending on the design and its operation, a SiC growth system can contain significant amounts of nitrogen, which will lead to a fluctuating nitrogen residual doping in the grown material. A low and controlled nitrogen background is necessary for reproducible growth of semiinsulating wafers and low doped epi-layers. SIMS feedback of nitrogen in these crystals can provide understanding of the compensation mechanism and process conditions.
For many years, SIMS has been used routinely to determine nitrogen concentration at level of E17 to E19 atoms/cm3 with good precision. Today’s state of the art SiC growth can produce semiinsulating crystals with a background doping around 5×10¹⁵ atoms/cm3 or lower. It requires SIMS to have better precision to measure low level nitrogen concentration.
With upgraded SIMS instrumentation (improved vacuum and better primary beam intensity) and improved analysis protocol, we can now achieve N detection limit of 2-5E15 atoms/cm3 routinely while maintaining excellent depth resolution. While these detection limits are very good, they are not sufficient to provide a routine way for an accurate measurement of low level (<5e15 atoms/cm3) nitrogen concentration in silicon carbide. A simple background removal at these background levels (2-5E15 atoms/cm3) can introduce large and un-defined errors. An extremely low nitrogen background (6- 8E14 atoms/cm3) is achievable, but is very time consuming and cannot be guaranteed at all the times.
To determine low nitrogen concentrations with adequate precision, it requires [1] (a) better Signal-to-Noise ratio; (b) a proper way to subtract background contribution from the measured signal, because the background contribution can change over time, and can also vary from location to location in a SIMS sample holder. To solve these issues, we applied the SIMS “raster changing” technique to a silicon carbide sample with low level of nitrogen concentration (<5e15 atoms/cm3) in order to determine the nitrogen concentration in the sample and to verify the precision of the result. The “raster changing” method provides an accurate way to determine and remove contribution of background nitrogen to the signal, because secondary ion intensities and matrix ion intensities can be analyzed at same location of sample by changing primary beam raster size during a profile [2]. The disadvantage of this technique is that it can be used only on uniformly doped sample or in the region of depth where the concentration is uniform.
EXPERIMENTAL
The experiments were performed using a CAMECA IMS-4f double focusing magnetic sector instruments equipped with oxygen and/or Cs primary beam sources. The samples were sputtered by a focused Cs+ primary ion beam, which is rastered over a square area. Beam current used in the analysis are 200 to 300 nA. Secondary ions formed during the sputtering process are accelerated away from the sample surface by a sample voltage of – 4500 V. Secondary ions were energy separated by an Electrostatic Analyzer and mass separated based on their mass/charge ratio by a Magnetic Mass Analyzer. After passing through the analyzers, the ions are detected using either a Faraday cup (Matrix ions) or an Electron Multiplier (nitrogen ions).
Samples included both very low N-doped bulk SiC and N-doped SiC epi grown on N-doped bulk SiC.
RESULTS & DISCUSSION
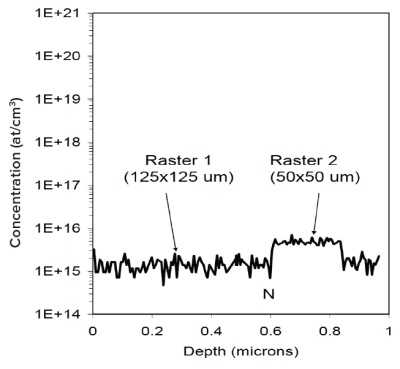
In this experiment, nitrogen concentration was determined from nitrogen (N+13 C)- and matrix (Si)- secondary ion intensity at 125 μm x 125 μm raster and 50 μm x 50 μm raster (Fig. 1). The nitrogen concentration [N] in the SiC sample and contribution of nitrogen from instrument background [NB] can be calculated using Eq. 1 and Eq. 2 [2]:
[N] = RSF × (IN1-IN2)/(IM1-IM2) (1)
[NB1] = RSF × (IN1/IM1) – [N] (2)
Where RSF is Relative Sensitivity Factor determined from nitrogen implant standard in SiC used for nitrogen concentration calibration; IN1-IN2 are nitrogen secondary ion intensities under two different rasters, and IM1-IM2 are corresponding matrix secondary ion intensities under these two different rasters.
The average nitrogen concentration determined from three measurements is 3.5E15 atoms/cm3 with precision of ±9% (1 relative standard deviation). Results demonstrated that low level nitrogen can be measured with good precision, even at relatively high nitrogen background level, using raster changing technique.
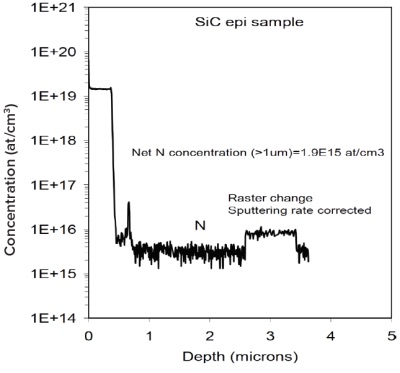
We also applied raster change technique to a SiC epi sample in the low nitrogen concentration region that has nitrogen doped layers on top of it (Fig. 2). The nitrogen was detected in this layer with net nitrogen concentration of 1.9E15 atoms/cm3. The sputtering rate for normal raster region was determined from implant standard, and sputtering rate at reduced raster region was derived from the matrix current ratio.
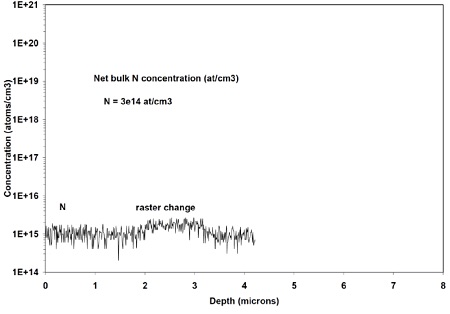
Lastly, we applied the raster change technique to a very low level of bulk N in SiC (Fig. 3). Here the detected N is 3E14 atoms/cm3.
SUMMARY
The SIMS measurement of very low levels of N in SiC has been successfully achieved using the raster change technique. This method can be applied to bulk SiC, epi SiC, and down to N levels as low as 3E14 atoms/cm3.
ACKNOWLEDGEMENT
We would like to thank Okmetic AB, Sweden, for providing samples used in this study.
REFERENCES
[1] R.S. Hockett, et al., in High Purity Silicon VI, Electrochemical Society PV 2000-17, 2000, p. 584.
[2] A. Ishitani, et al., in Proceedings of the international Conference on Materials and Process Characterization for VLSI (ICMPC’88), 1988, p. 124.
Would you like to learn more about SIMS Analysis of Nitrogen in Silicon Carbide?
Contact us today for your SIMS analysis of nitrogen in Silicon Carbide needs. Please complete the form below to have an EAG expert contact you.