Compositional analysis of glass and glass products
Home » Compositional analysis of glass and glass products
Glass development and glass product verification requires the measurement of composition with high accuracy. Eurofins EAG laboratories offers a broad portfolio for compositional analysis.
Bulk Glass Composition
Major constituents
Measure major and minor glass constituents
Li-U elemental coverage, except C,N,O
Compositions accurate to within 5-10% for major elements
Free water content (loss on drying (LOD))
Carbonates, organic compounds, crystal water (loss on ignition (LOI))
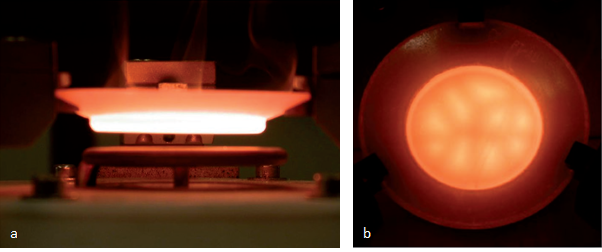
High frequency fusion fluxer for the preparation of fused glass beads: side view (a) and top view (b)
Trace elements and ultra-trace impurities
Almost full periodic table elemental coverage
Trace level detection limits down to the ppm range
Analyze impurities in quartz glass/sand down to ultra-trace (sub-ppm) levels
Trace level components accurate to within 20%
Ultra-trace level components accurate to within 20-50%
Inclusions and Small Area
Measure areas as small as 4 µm with a typical sampling depth of ~1 µm
Identify inclusions
Identify glass type
Analysis of thin films on glass
Achieving consistently high precision and high accuracy
The quality of the analytical result is reflected in its precision and its accuracy: Precision is the variance on the final result and is typically affected most by analytical equipment, sample preparation and sampling. Because of the high quality and stability, the analytical equipment used has a smaller overall contribution to the precision. The availability of advanced sample preparation techniques and highly skilled technicians minimizes the variance in sample preparation. Representative sampling is therefore a prime factor to enable good precision, which sometimes requires a statistical approach. Adequate accuracy is realized by careful calibration with appropriate reference materials and standards.
Recycle Glass Characterization
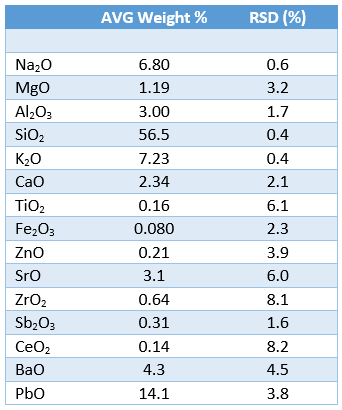
Recycling of glass has become an increasingly important topic for glass production due to the potential reduction in energy costs and environmental impact. The chemical composition of large cullet batches up to 5 kg (i.e. batches of waste glass for recycling) can be determined using XRF. This is a typical example where accurate and reliable sampling is the decisive parameter for the relevancy of the final result. The table below shows the final result of four independent samplings on a large cullet batch. These results demonstrate that the average composition and its “homogeneity” can be determined by XRF extremely well.
Average cullet batch (recycling glass) composition of four independent samples analyzed by XRF. In the third column the relative standard deviation of the four measurements is presented.
Surface composition
Wash and rinse: Thin film trace level surface contamination
Adhesion, reliability and appearance of coatings can be affected by surface residue. The efficacy of the cleaning process should be well understood, and identification of any residues should be investigated.
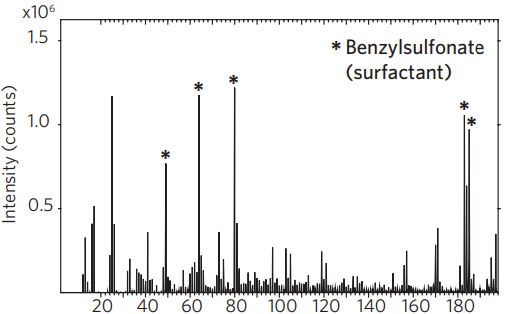
Figure 1 shows Time-of-Flight Secondary Ion Mass Spectrometry (TOF-SIMS) which has very high sensitivity and a very shallow sampling depth making it ideal for detecting organic and inorganic surface residues. Residues can have a detrimental effect on coating adhesion, appearance, yields and performance. TOF-SIMS survey analysis shows:
Identity of residues
Difference between ‘good’ and ‘bad’
ppm detection limits
Glass surface modification
SIMS profile
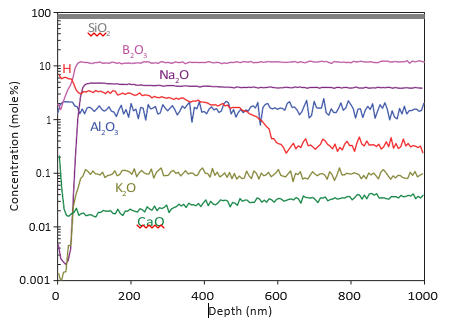
Exposure of glass surfaces to various treatments can result in a change in surface composition and chemistry. The penetration depth of these changes and the composition can be measured by Secondary Ion Mass Spectrometry (SIMS).
De-alkalization by hydration
Hydration is the process where hydronium ions diffuse into a glass surface and exchange with alkali and other metals. Hydronium concentration and ingress depth can be measured using SIMS. The depletion of alkali concentration at the surface and the depth of depletion can also be measured.
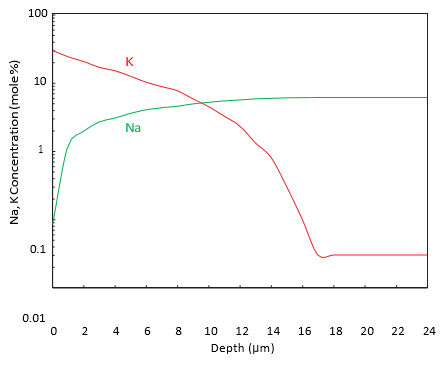
Ion exchange
Potassium can be substituted for sodium in the glass matrix using an ion exchange process. The resulting glass is much stronger than before.
SIMS concentration profiles of Na and K reveals how far into the material the exchange process has occurred.
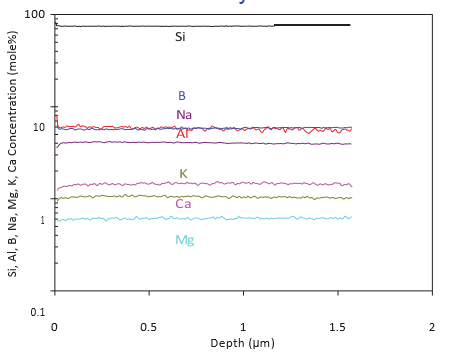
SIMS profile of mobile elements
SIMS profile of a newly cleaned surface
Minimal artefacts
Alkali metals are also called ‘mobile ions’ because they are easily moved by electric fields such as those caused by the SIMS primary ion charged particle beam.
With the correct analysis conditions, we can minimize migration caused by SIMS. Here we show a glass cleaved surface profile demonstrating SIMS has caused almost no profile distortions on this fresh fractured surface.
Would you like to learn more about Compositional analysis of glass?
Contact us today for your compositional analysis of glass and glass product needs. Please complete the form below to have an EAG expert contact you.
To enable certain features and improve your experience with us, this site stores cookies on your computer.
Please click Continue to provide your authorization and permanently remove this message.