In recent years, the contact lens market has expanded beyond its original goal of vision correction to include products with decorative qualities. One of the examples of such products are Decorative Soft Contact Lenses (DSCLs), also referred to as Pigmented or Tinted Contact Lenses. The pigmented lenses appear in different styles, colors, and patterns, utilize different types of pigments, and are available with or without prescription. Location and distribution of the pigments are of importance to both manufacturers and consumers. Studies have shown that the presence of pigments on the surface of the contact lens may cause inflammation and pose risks to the actual surface of the eye1. Various analytical methods have been applied to evaluate pigment location and depth distribution in decorative soft contact lenses (DSCLs)2.
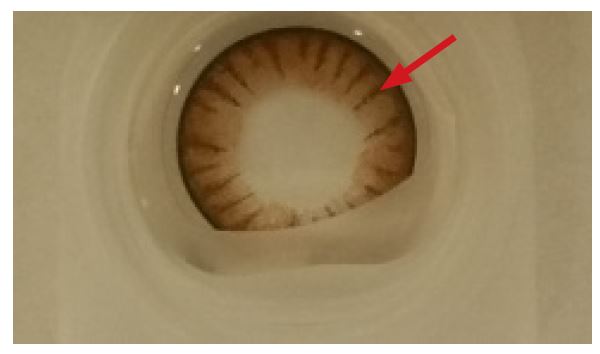
Figure 1a. This optical image shows the top view of a lens examined in this study. The red arrow indicates where the lens was sectioned for SEM analysis using a cryo-microtome with a diamond blade.
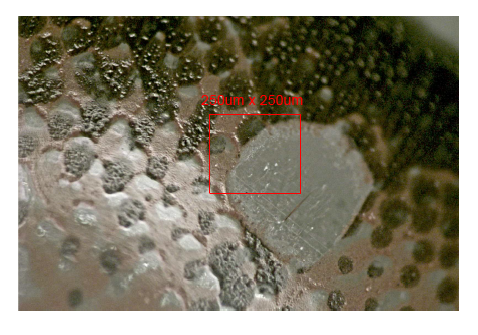
Figure 1b. The red box in this optical image shows the location of the TOF-SIMS analysis.
In this study, the surface and bulk of a commercially obtained pigmented contact lens (Fig. 1a) were characterized using the multi-technique approach available at Eurofins EAG Laboratories. The study, which included optical imaging, BSE (backscattered electron) cross-sectional imaging, XPS Depth profiling, and TOF-SIMS ion imaging, provided useful information on the pigment surface exposure and depth distribution.
In this study, the surface and bulk of a commercially obtained pigmented contact lens (Fig. 1a) were characterized using the multi-technique approach available at Eurofins EAG Laboratories. The study, which included optical imaging, BSE (backscattered electron) cross-sectional imaging, XPS Depth profiling, and TOF-SIMS ion imaging, provided useful information on the pigment surface exposure and depth distribution.
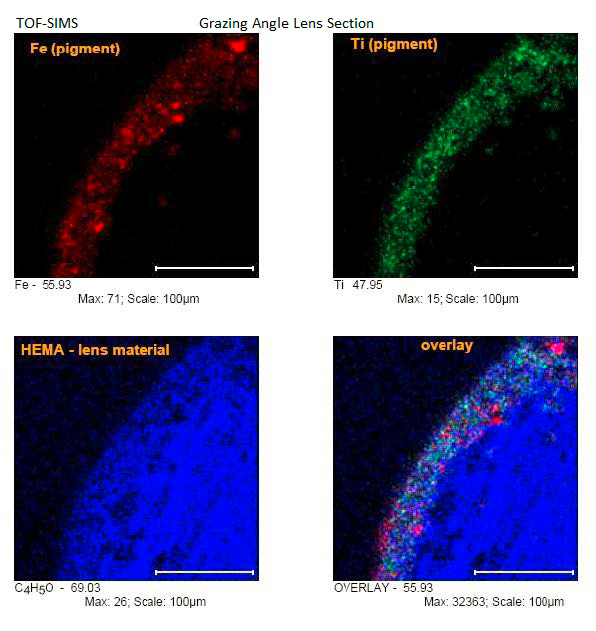
The composition of the lens was unknown prior to the analysis. TOF-SIMS examination was performed on a grazing angle cross-section of the lens (Fig. 1b). The grazing angle broadened surface features for a more detailed analysis.
The grazing angle broadened surface features for a more detailed analysis. HEMA (hydroxyethylmethacrylate) was identified as the base material of the lens and the near surface had two pigment components, Fe oxide and Ti oxide, distributed as particulate (Fig. 2).
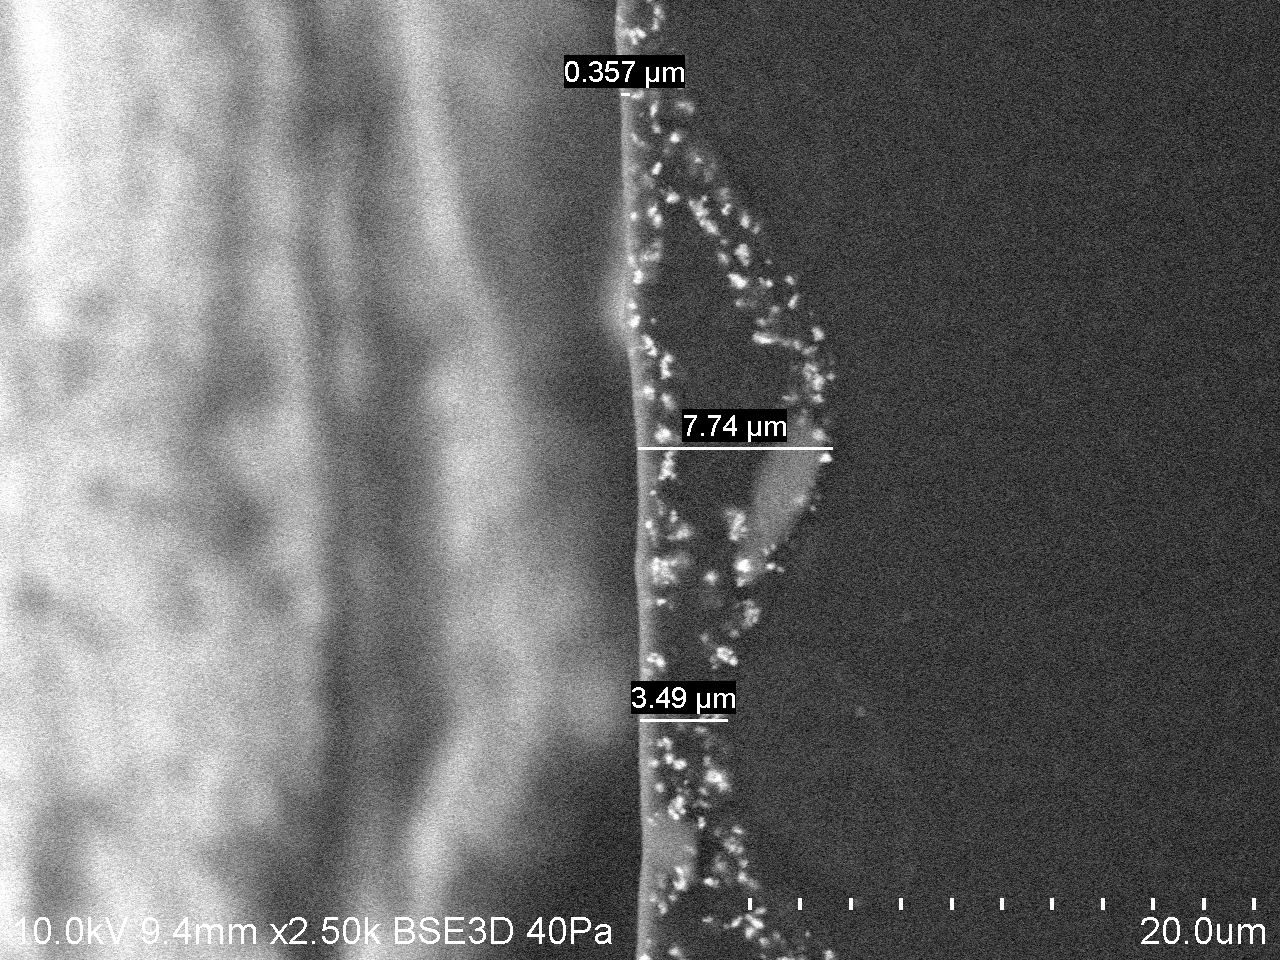
The BSE (backscattered electron) image (Fig. 3) of the normal angle cross-section helped to visualize the spatial distribution of pigments, present as particles of different sizes and distributed at various depths in different locations. The range of depth distribution of pigments obtained from the BSE image was approximately from 0.4µm to 7.6µm.
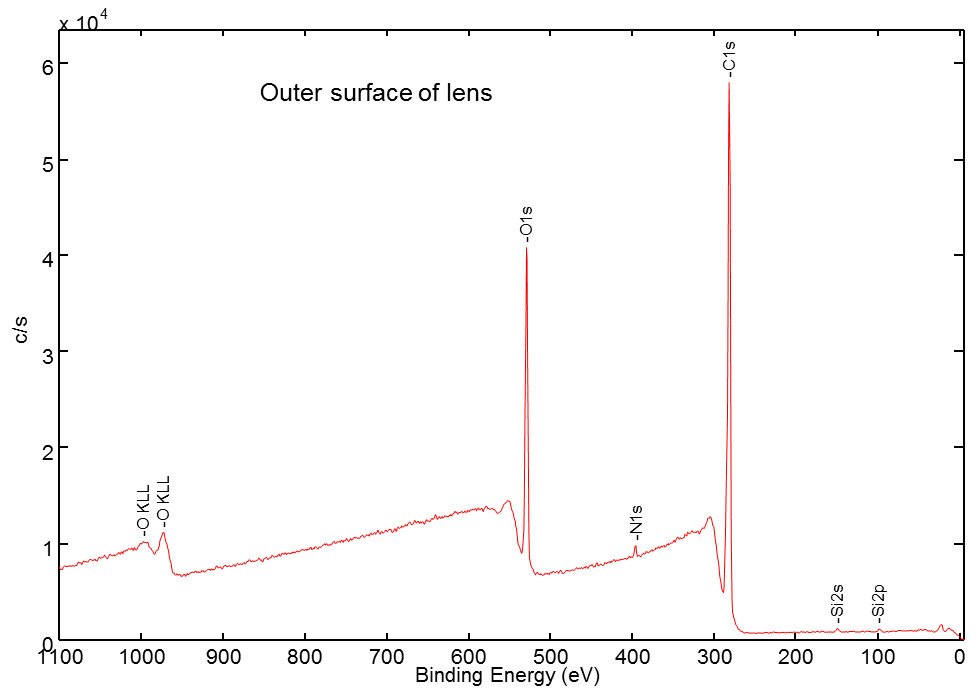
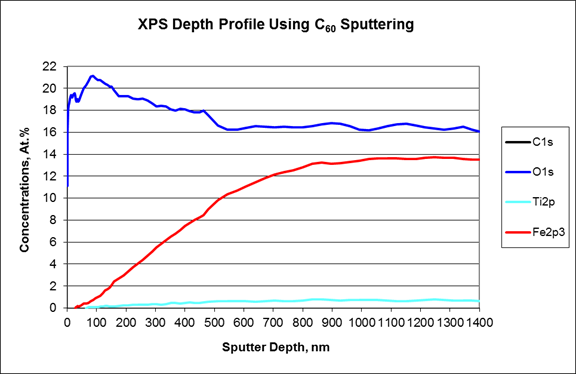
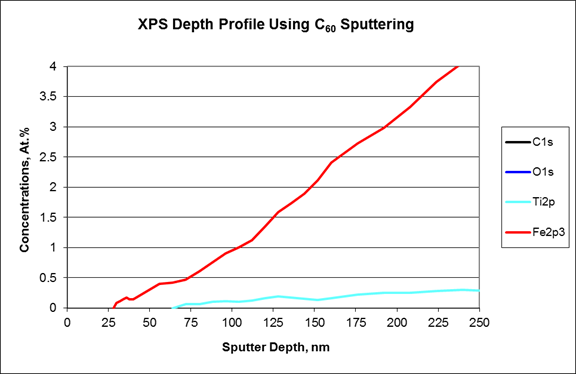
The XPS analysis was started on the outer surface of the darkest circle near the circumference of the lens. Only carbon, nitrogen, oxygen, and silicon were detected in the surface survey spectrum, while no trace of pigment components were observed (Fig. 4). The XPS depth profile was carried out using a C60 ion gun to minimize damage to organic materials during sputtering. The profile showed that the Fe oxide pigment was present at much higher concentration than the Ti oxide one (Fig. 5a). Additionally, the Ti oxide signal was not observed until much deeper than the Fe oxide (Fig.5b). Both were found underneath the organic layer without any surface exposure.
In conclusion, a combination of analytical methods showed that the examined pigmented lens contained majority Fe oxide and minority Ti oxide pigments present in the form of particles distributed over a wide depth and lateral range, however, the pigment particulates were not exposed at the surface of the lens; therefore, they were not likely to cause abrasive damage to the eye or surrounding tissue.
Figure 2. TOF-SIMS imaging of the grazing angle lens section shows the Fe oxide pigment (red), Ti oxide pigment (green) distribution and the HEMA (hydroxyethylmethacrylate) lens material (blue). Pigment signal at the surface of the lens was not evident.
Figure 3. The BSE (backscattered electron) image of the normal angle lens cross-section (with the convex surface on the left side of the image) shows bright areas of Fe oxide and Ti oxide pigments reaching depths to 7.74 µm.
Figure 4. XPS survey spectrum of outer surface above the dark ring. No pigment specific species were observed.
Figure 5a. XPS depth profiling shows the pigments are not exposed at the immediate surface, and the concentration of Fe oxide pigment is much higher than that of Ti oxide. The most abundant element of the lens material, C, is not shown in order to focus on the distribution of elements with lower concentrations.
Figure 5b. The zoomed-in view of the XPS depth profile shows that Ti oxide pigment was distributed further from the surface than the Fe oxide.
Would you like to learn more about analysis of Pigmented contact lenses?
Contact us today for your analysis of pigmented contact lens needs. Please complete the form below to have an EAG expert contact you.
To enable certain features and improve your experience with us, this site stores cookies on your computer.
Please click Continue to provide your authorization and permanently remove this message.