
Coffee and Conversations – Thin Film Characterization
May 15, 2024
Please join us for coffee and conversations! Enjoy a cup of coffee and pastries as you get to know our technical experts.

May 15, 2024
Please join us for coffee and conversations! Enjoy a cup of coffee and pastries as you get to know our technical experts.

Knowing the type of stress and how much there is in a small metal component in a medical device can be the determining factor on how well the device will perform, how long the device will last, or even whether or not the device is going to work at all.
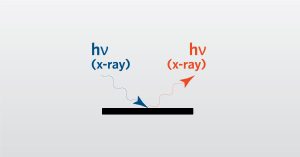
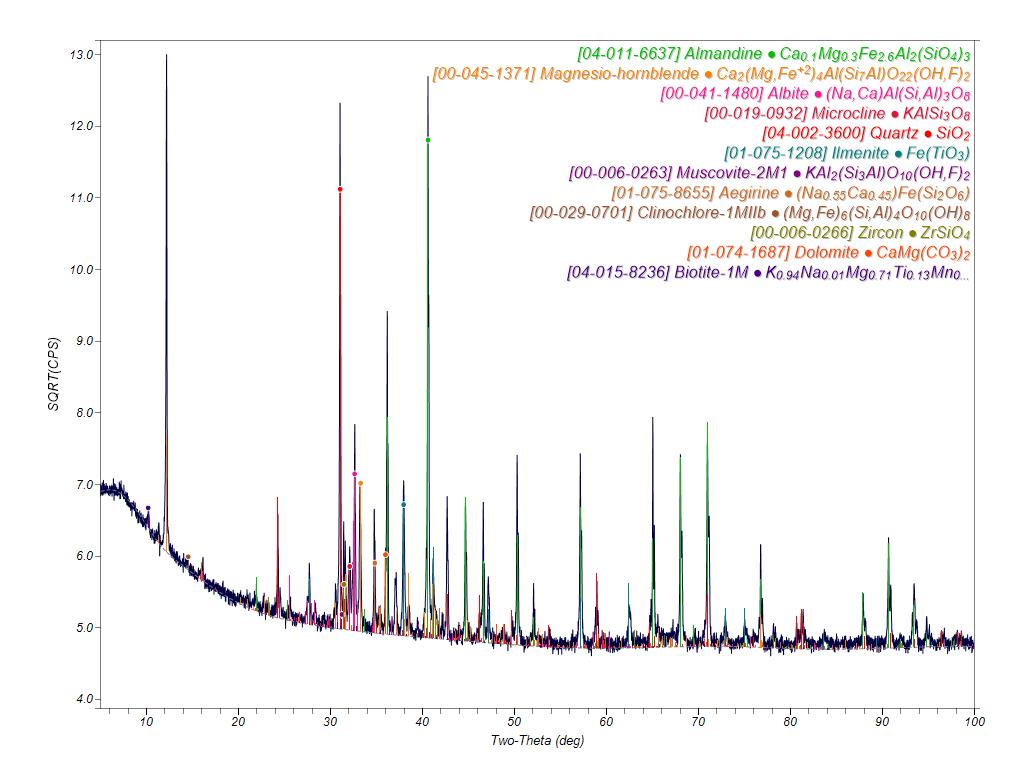
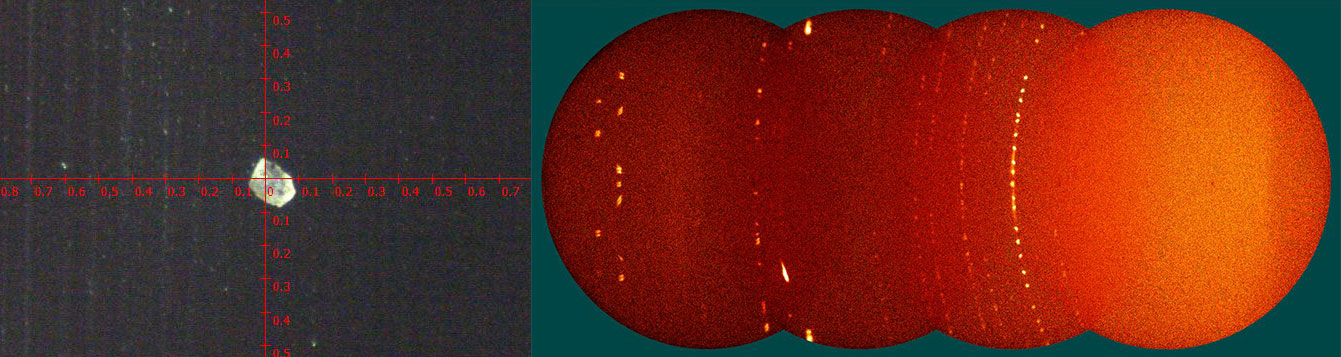
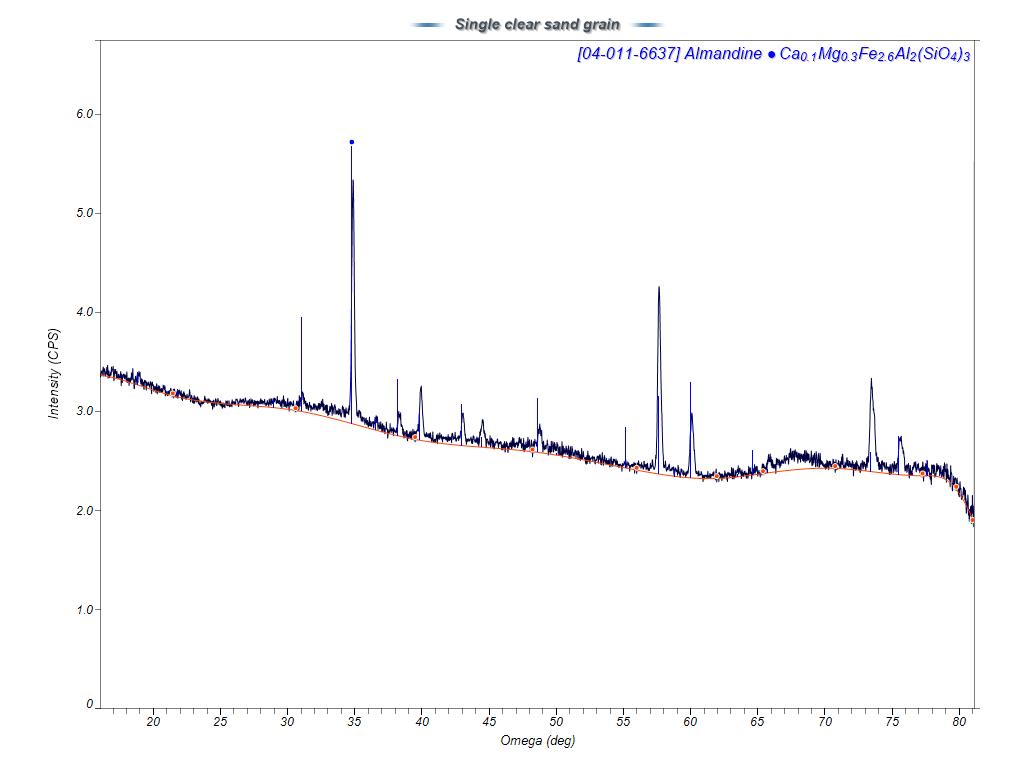
In this webinar we introduce X-ray Diffraction (XRD) which is a analytical technique for the examination of crystalline materials.
To be hermetically sealed essentially means to be airtight so that nothing can come in or get out (i.e., gas, moisture, liquid, etc.).
To enable certain features and improve your experience with us, this site stores cookies on your computer. Please click Continue to provide your authorization and permanently remove this message.
To find out more, please see our privacy policy.